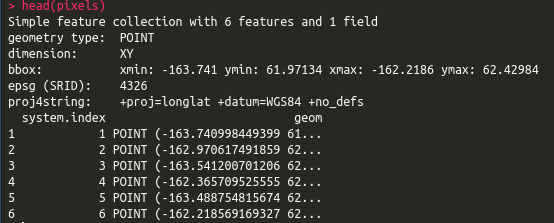
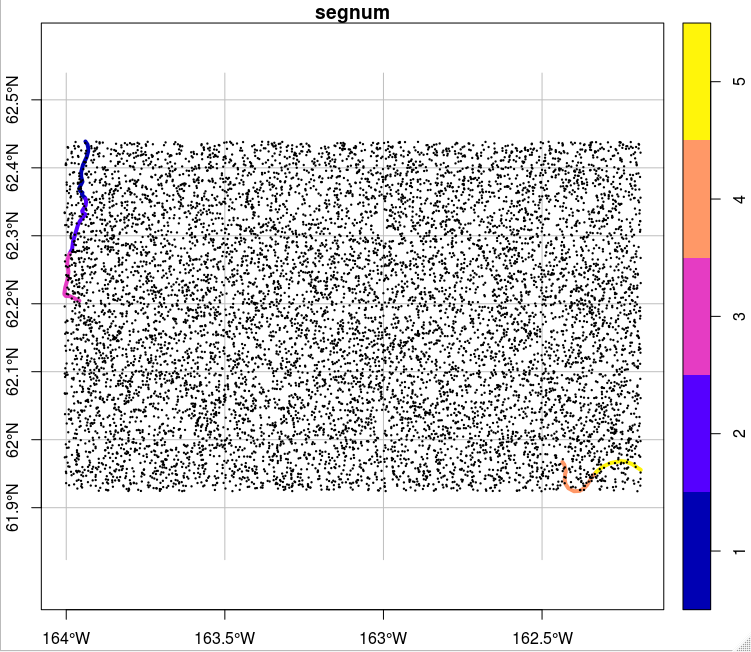
I've seen similar questions, but not with R. I have a sf object with approx 500000 thousand points. I also have an sf object of lines. Each line has a unique segment number called 'segnum'. For each pixel, I want to know which line (identified by segment number) is the closest. The point and line files are currently in geographic coordinates (crs = 4326), but I can reproject them if need be.
Based on this question (How to calculate distance from POINT to LINESTRING in R using `sf` library and get all POINT features from LINESTRING where distances were calculated?) I was thinking of using dist2line from geosphere.
For example: dist = geosphere::dist2Line(p=st_coordinates(pixels), line = st_coordinates(lines)[,1:2])
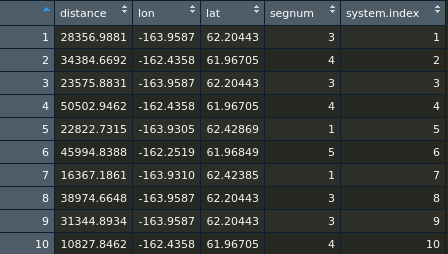
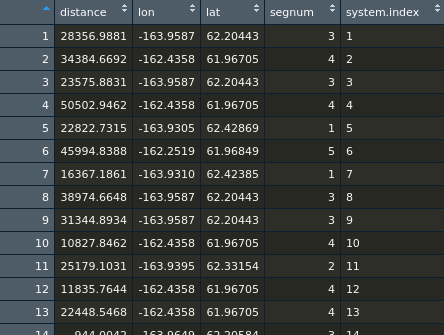
But that just gives you the distance from the point to the line. It doesn't tell you which line segment is closest. Any ideas of how to do this?
Here is a small sample of my data:
pixels = structure(list(id = c("1", "1", "1", "1", "1"), system.index = 0:4,
    b2_allPix = c(7009L, 3932L, 7329L, 5734L, 6525L), b2_cloudfilt = c(0L,
    3932L, 0L, 0L, 0L), system.time_start = c(951350400000, 951350400000,
    951350400000, 951350400000, 951350400000), .geo = c(NA, NA,
    NA, NA, NA), geometry = structure(list(`1` = structure(c(-137.849125851618,
    66.7968749939405), class = c("XY", "POINT", "sfg")), `2` = structure(c(-137.838550341857,
    66.7968749939405), class = c("XY", "POINT", "sfg")), `3` = structure(c(-137.879732491708,
    66.7947916606074), class = c("XY", "POINT", "sfg")), `4` = structure(c(-137.862752400773,
    66.7927083272742), class = c("XY", "POINT", "sfg")), `5` = structure(c(-137.881661018612,
    66.7885416606079), class = c("XY", "POINT", "sfg"))), .Names = c("1",
    "2", "3", "4", "5"), class = c("sfc_POINT", "sfc"), precision = 0, bbox = structure(c(-137.881661018612,
    66.7885416606079, -137.838550341857, 66.7968749939405), .Names = c("xmin",
    "ymin", "xmax", "ymax"), class = "bbox"), crs = structure(list(
        epsg = 4326L, proj4string = "+proj=longlat +datum=WGS84 +no_defs"), .Names = c("epsg",
    "proj4string"), class = "crs"), n_empty = 0L)), .Names = c("id",
"system.index", "b2_allPix", "b2_cloudfilt", "system.time_start",
".geo", "geometry"), row.names = c(NA, 5L), class = c("sf", "data.frame"
), sf_column = "geometry", agr = structure(c(1L, 1L, 1L, 1L,
1L, 1L), .Names = c("id", "system.index", "b2_allPix", "b2_cloudfilt",
"system.time_start", ".geo"), .Label = c("constant", "aggregate",
"identity"), class = "factor"))

lines = structure(list(id = structure(c(1L, 112L, 223L, 334L, 445L), .Label = c("1",
"10", "100", "101", "102", "103", "104", "105", "106", "107",
"108", "109", "11", "110", "111", "112", "113", "114", "115",
"116", "117", "118", "119", "12", "120", "121", "122", "123",
"124", "125", "126", "127", "128", "129", "13", "130", "131",
"132", "133", "134", "135", "136", "137", "138", "139", "14",
"140", "141", "142", "143", "144", "145", "146", "147", "148",
"149", "15", "150", "151", "152", "153", "154", "155", "156",
"157", "158", "159", "16", "160", "161", "162", "163", "164",
"165", "166", "167", "168", "169", "17", "170", "171", "172",
"173", "174", "175", "176", "177", "178", "179", "18", "180",
"181", "182", "183", "184", "185", "186", "187", "188", "189",
"19", "190", "191", "192", "193", "194", "195", "196", "197",
"198", "199", "2", "20", "200", "201", "202", "203", "204", "205",
"206", "207", "208", "209", "21", "210", "211", "212", "213",
"214", "215", "216", "217", "218", "219", "22", "220", "221",
"222", "223", "224", "225", "226", "227", "228", "229", "23",
"230", "231", "232", "233", "234", "235", "236", "237", "238",
"239", "24", "240", "241", "242", "243", "244", "245", "246",
"247", "248", "249", "25", "250", "251", "252", "253", "254",
"255", "256", "257", "258", "259", "26", "260", "261", "262",
"263", "264", "265", "266", "267", "268", "269", "27", "270",
"271", "272", "273", "274", "275", "276", "277", "278", "279",
"28", "280", "281", "282", "283", "284", "285", "286", "287",
"288", "289", "29", "290", "291", "292", "293", "294", "295",
"296", "297", "298", "299", "3", "30", "300", "301", "302", "303",
"304", "305", "306", "307", "308", "309", "31", "310", "311",
"312", "313", "314", "315", "316", "317", "318", "319", "32",
"320", "321", "322", "323", "324", "325", "326", "327", "328",
"329", "33", "330", "331", "332", "333", "334", "335", "336",
"337", "338", "339", "34", "340", "341", "342", "343", "344",
"345", "346", "347", "348", "349", "35", "350", "351", "352",
"353", "354", "355", "356", "357", "358", "359", "36", "360",
"361", "362", "363", "364", "365", "366", "367", "368", "369",
"37", "370", "371", "372", "373", "374", "375", "376", "377",
"378", "379", "38", "380", "381", "382", "383", "384", "385",
"386", "387", "388", "389", "39", "390", "391", "392", "393",
"394", "395", "396", "397", "398", "399", "4", "40", "400", "401",
"402", "403", "404", "405", "406", "407", "408", "409", "41",
"410", "411", "412", "413", "414", "415", "416", "417", "418",
"419", "42", "420", "421", "422", "423", "424", "425", "426",
"427", "428", "429", "43", "430", "431", "432", "433", "434",
"435", "436", "437", "438", "439", "44", "440", "441", "442",
"443", "444", "445", "446", "447", "448", "449", "45", "450",
"451", "452", "453", "454", "455", "456", "457", "458", "459",
"46", "460", "461", "462", "463", "464", "465", "466", "467",
"468", "469", "47", "470", "471", "472", "473", "474", "475",
"476", "477", "478", "479", "48", "480", "481", "482", "483",
"484", "485", "486", "487", "488", "489", "49", "490", "491",
"492", "493", "494", "495", "496", "497", "498", "499", "5",
"50", "500", "501", "502", "503", "504", "505", "506", "507",
"508", "509", "51", "510", "52", "53", "54", "55", "56", "57",
"58", "59", "6", "60", "61", "62", "63", "64", "65", "66", "67",
"68", "69", "7", "70", "71", "72", "73", "74", "75", "76", "77",
"78", "79", "8", "80", "81", "82", "83", "84", "85", "86", "87",
"88", "89", "9", "90", "91", "92", "93", "94", "95", "96", "97",
"98", "99"), class = "factor"), segnum = 1:5, geometry = structure(list(
    structure(c(-163.939480000102, -163.932950000242, -163.930539999721,
    -163.93100000025, -163.933320000218, -163.935640000186, -163.941510000186,
    -163.947380000187, -163.950175000026, -163.952969999866,
    -163.952909999797, -163.948820000043, -163.953614999932,
    -163.958409999822, -163.958460000329, -163.955969999716,
    -163.948809999582, -163.950620000313, -163.94980000027, -163.945235000195,
    -163.94067000012, -163.93931771722, 62.4387199999281, 62.4343600003138,
    62.4286899996438, 62.4238500003773, 62.4198250000238, 62.4157999996703,
    62.4099199996583, 62.4040399996463, 62.3988099999316, 62.3935800002169,
    62.387119999988, 62.3795499998327, 62.3751399997113, 62.3707299995899,
    62.3691199999881, 62.3658599998392, 62.3633900001485, 62.3612500003873,
    62.3598899997237, 62.3578349998354, 62.3557799999471, 62.3541680789363
    ), .Dim = c(22L, 2L), class = c("XY", "LINESTRING", "sfg"
    )), structure(c(-163.93931771722, -163.938169999946, -163.93740000041,
    -163.938740000151, -163.944244999957, -163.949749999763,
    -163.947819999793, -163.939500000125, -163.945110000126,
    -163.950720000128, -163.956330000129, -163.959765000255,
    -163.96320000038, -163.967020000273, -163.970840000166, -163.974660000059,
    -163.978479999952, -163.979979999877, -163.981479999802,
    -163.985049999858, -163.988619999913, -163.988893564025,
    62.3541680789363, 62.3528000001199, 62.3498299998546, 62.3447300002894,
    62.3405950002591, 62.3364600002289, 62.3337599998242, 62.3315399999711,
    62.3283500000525, 62.325160000134, 62.3219700002154, 62.3189000002849,
    62.3158300003543, 62.3098650002446, 62.303900000135, 62.2979350000253,
    62.2919699999156, 62.2861900000185, 62.2804100001214, 62.2773400001909,
    62.2742700002603, 62.2739300405841), .Dim = c(22L, 2L), class = c("XY",
    "LINESTRING", "sfg")), structure(c(-163.988893564025, -163.992389999749,
    -163.996159999584, -163.996669999721, -163.994829999855,
    -163.992989999988, -163.994169999995, -163.995350000002,
    -163.999320000068, -164.003290000133, -164.005879999962,
    -164.005639999686, -164.001679999632, -163.995054999888,
    -163.988430000144, -163.980987500023, -163.973544999902,
    -163.966102499781, -163.958659999659, 62.2739300405841, 62.2695850000478,
    62.2648999998352, 62.2581699997457, 62.2527699998357, 62.2473699999256,
    62.2422650001297, 62.2371600003338, 62.2304550000483, 62.2237499997627,
    62.2154199996334, 62.2137999995704, 62.2114799996024, 62.2112999998452,
    62.211120000088, 62.2094475000771, 62.2077750000662, 62.2061025000554,
    62.2044300000445), .Dim = c(19L, 2L), class = c("XY", "LINESTRING",
    "sfg")), structure(c(-162.435819999793, -162.430109999976,
    -162.427880000112, -162.425650000247, -162.425349999903,
    -162.42719999978, -162.428489999914, -162.42620000043, -162.421750000262,
    -162.417300000095, -162.41132999998, -162.405359999864, -162.399389999749,
    -162.390509999887, -162.381630000024, -162.37460000004, -162.367570000055,
    -162.363089999854, -162.358609999652, -162.352496666488,
    -162.346383333324, -162.34027000016, -162.333680000232, -162.329452505243,
    61.9670499997578, 61.9634399996563, 61.9593549996835, 61.9552699997108,
    61.9520299995849, 61.9504499995679, 61.9418499995779, 61.9350699998806,
    61.9318899998237, 61.9287099997667, 61.9272066666544, 61.9257033335421,
    61.9242000004297, 61.9244350000253, 61.9246699996208, 61.9266249998439,
    61.928580000067, 61.9307850001277, 61.9329900001884, 61.9375400001709,
    61.9420900001534, 61.946640000136, 61.9500199999731, 61.9521882750156
    ), .Dim = c(24L, 2L), class = c("XY", "LINESTRING", "sfg"
    )), structure(c(-162.329452505243, -162.327090000303, -162.321173333582,
    -162.315256666862, -162.309340000141, -162.300583333454,
    -162.291826666767, -162.28307000008, -162.275282500012, -162.267494999944,
    -162.259707499876, -162.251919999808, -162.244499999825,
    -162.237079999842, -162.230319999868, -162.223559999894,
    -162.21679999992, -162.209842499906, -162.202884999893, -162.195927499879,
    -162.188969999866, 61.9521882750156, 61.9533999998102, 61.9556199999631,
    61.957840000116, 61.9600600002689, 61.9619966669127, 61.9639333335566,
    61.9658700002004, 61.9665250000538, 61.9671799999071, 61.9678349997605,
    61.9684899996138, 61.9682049999608, 61.9679200003078, 61.9667066667793,
    61.9654933332508, 61.9642799997222, 61.9621174998228, 61.9599549999234,
    61.9577925000239, 61.9556300001245), .Dim = c(21L, 2L), class = c("XY",
    "LINESTRING", "sfg"))), class = c("sfc_LINESTRING", "sfc"
), precision = 0, bbox = structure(c(-164.005879999962, 61.9242000004297,
-162.188969999866, 62.4387199999281), .Names = c("xmin", "ymin",
"xmax", "ymax"), class = "bbox"), crs = structure(list(epsg = 4326L,
    proj4string = "+proj=longlat +datum=WGS84 +no_defs"), .Names = c("epsg",
"proj4string"), class = "crs"), n_empty = 0L)), .Names = c("id",
"segnum", "geometry"), row.names = c(NA, 5L), class = c("sf",
"data.frame"), sf_column = "geometry", agr = structure(c(NA_integer_,
NA_integer_), .Names = c("id", "segnum"), .Label = c("constant",
"aggregate", "identity"), class = "factor"))


