4

I am trying to colour a single band grey raster (NDVI) using gdal to match the same colouring when I bring the raster into QGIS and colour it with a cumulative count cut (2%/98%). When I use the code:

  gdaldem color-relief raster_ndvi.tif colour_percent2test.txt -alpha  raster_ndvi_colour.tif

with my colour textfile:

98%  26   153  71      
74%  161  209  106    
50%  255  255  197   
26%  254  177  101      
2%   255   0    0 
nv   0     0    0    0

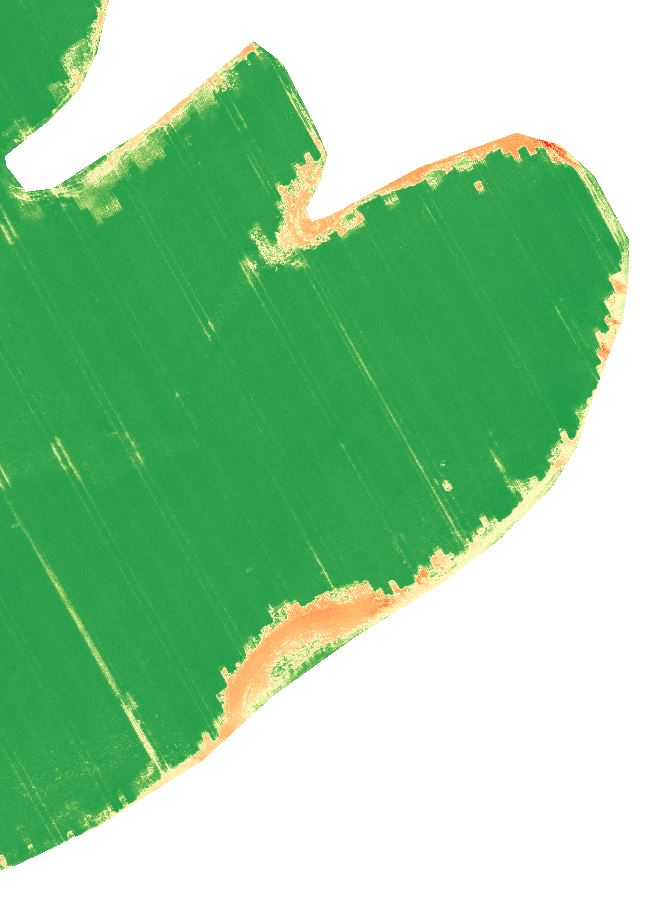
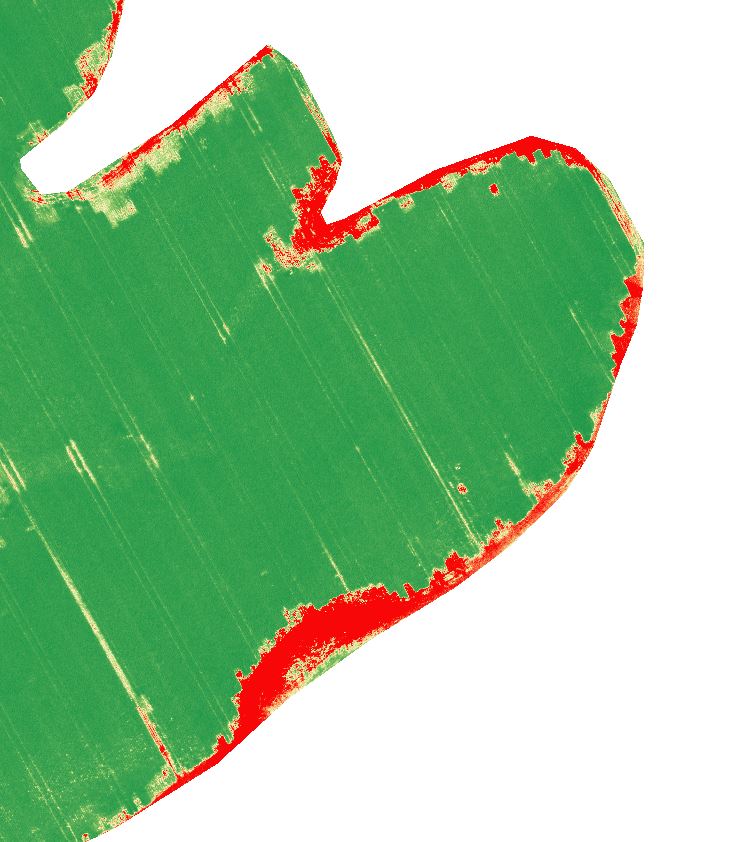
I get a similar raster as the QGIS version, but I don't see as much red

This is the QGIS output:

QGIS output

And this is what I get from the gdal code:

Gdal output

I have also tried using a colour textfile:

100% 26   153  71
98%  26   153  71      
74%  161  209  106    
50%  255  255  197   
26%  254  177  101      
2%   255   0    0 
0%   255   0    0 
nv   0     0    0    0

and it ends up looking the exact same as the other attempt.

Any suggestions on how I can get my colouring to match QGIS without typing in the actual raster values in the colour ramp?

I want to be able to colour multiple rasters this way without needing to know the raster values to type them into the textfile each time (so 0.37 = red, 0.504 = orange, etc.) as this would take more time and I may as well just use QGIS instead.

1 Answer 1

2

The cumulative count cuts are the 2nd and 98th percentiles of the raster band values. You can achieve this styling with gdal and numpy the following way.

import gdal
import numpy as np

src_ds = gdal.Open(single_band_raster)
src_band = src_ds.GetRasterBand(1)

array = src_band.ReadAsArray()
p2 = np.percentile(array, 2)
p98 = np.percentile(array, 98)

Then your color file should look like

p2 first_color some_opacity
....
some_intermediate_value some_intermediate_color some_opacity
...
p98 last_color some_opacity

for example

p2 = 30
p98 = 75

30 26 153 71
45 255 255 97
75 255 0 0

And you might want to exclude the

nv 0 0 0 0

line because, it will color values < p2 and > p98 transparent or whatever color you define. It you omit the line, values < p2 will get the first color and values > p98 will get the last color. I believe this is what happens in QGIS.

Also, your p2 and p98 values might be a little different than in QGIS because there 2 ways to calculate them in QGIS: Estimate (faster), Actual (slower). Estimate is the default.

Your Answer

By clicking “Post Your Answer”, you agree to our terms of service and acknowledge you have read our privacy policy.

Not the answer you're looking for? Browse other questions tagged or ask your own question.