3

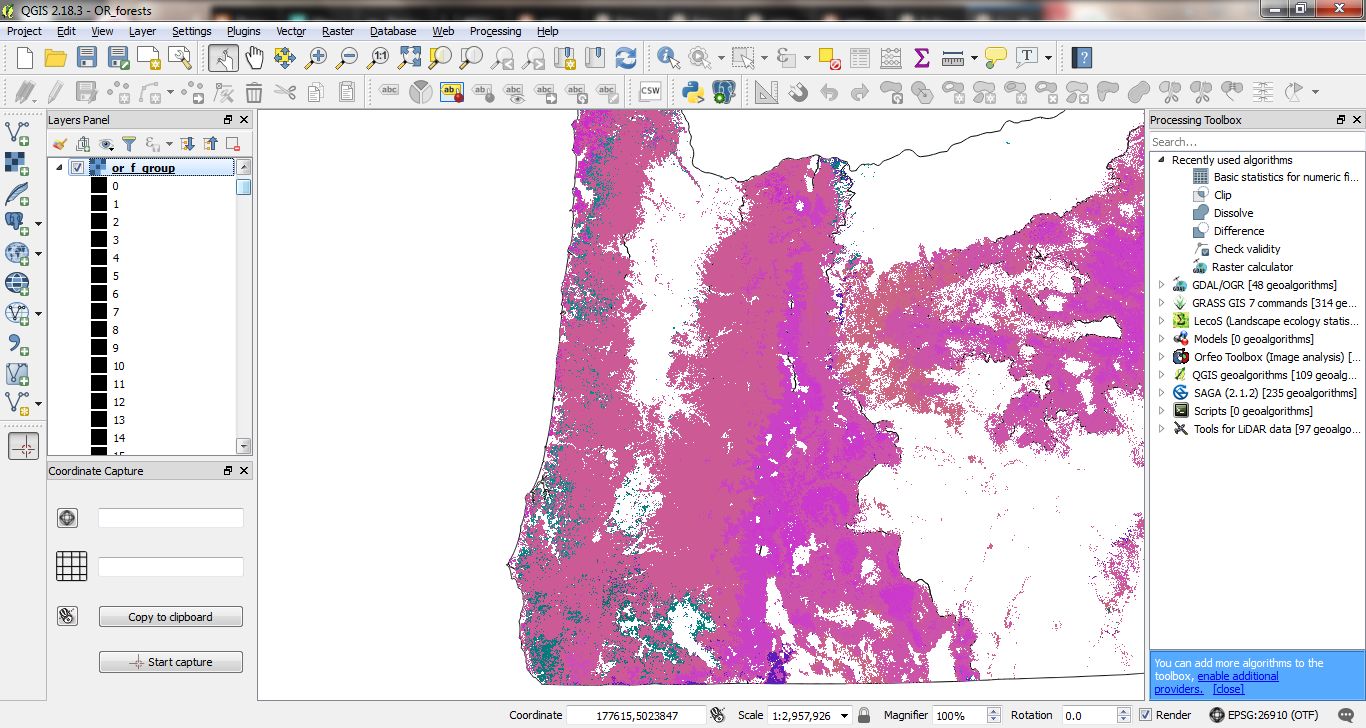
I am using QGIS 2.18.3 (I know, it's an old version now) on Windows 7. I have a raster of forest groups for Oregon, saved as the .img format and is rendered as Paletted. It was clipped from a raster of forest groups for the entire U.S. The legend in the Layers Panel for the OR layer has all of the forest group pixel values (a few hundred different values), even though there are only about 25 different pixel values in the OR layer.

How do I get the legend to not show all the values that don't actually occur in the layer?

Related to this, if I save as .tiff, the layer's legend only has min and max values, which leaves out a bunch of the pixel values.

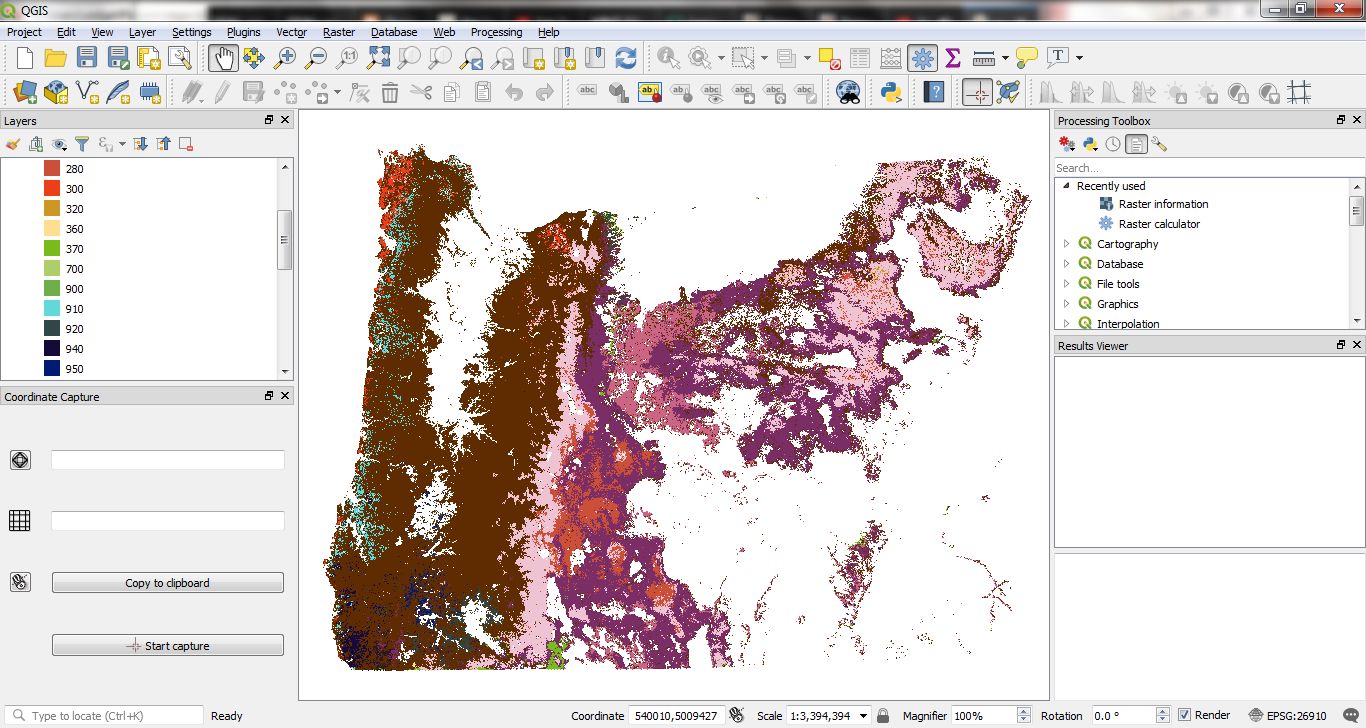
EDIT: I've added a screenshot of QGIS to show the legend. All the values that appear in the screenshot legend aren't used in the raster. Those, plus the other unused values, are the ones I want to remove.screenshot of unused legend values in QGIS.
3
  • This functionality can go by the names of dynamic legends or legend limiting.
    – PolyGeo
    Commented May 19, 2018 at 6:51
  • @PolyGeo thanks for the reply. Are those functions for working Print Composer or with the project layers directly? I searched for the terms you gave me and they seem to only apply to Print Composer. I'd rather edit the layer itself. I added a screen capture to show what I was talking about. Sorry if there was any confusion.
    – shea
    Commented May 20, 2018 at 4:58
  • They are ArcGIS terms but often QGIS and ArcGIS have similar terminology.
    – PolyGeo
    Commented May 20, 2018 at 8:45

1 Answer 1

0

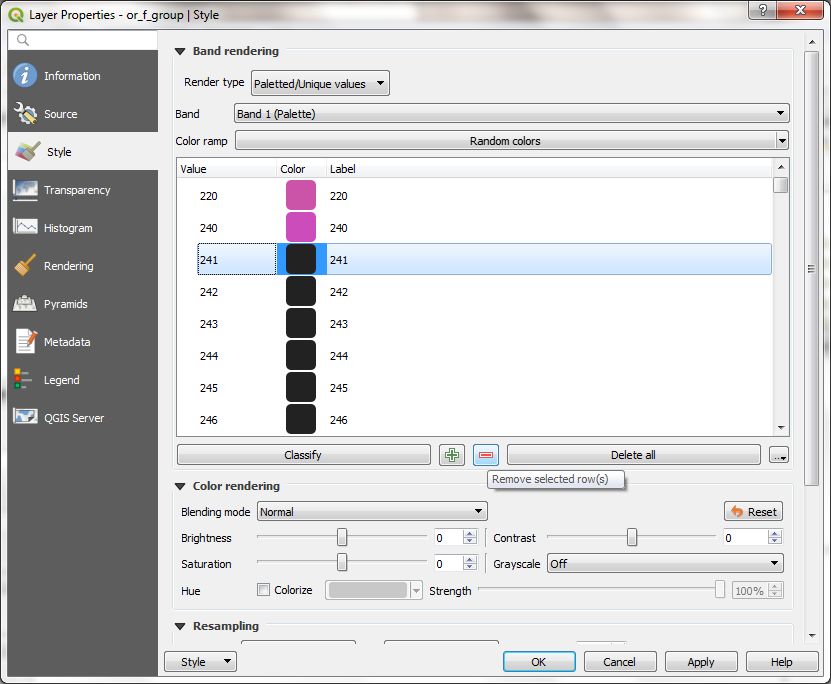
I hate to answer my own question, but it seems like I got at what I wanted. It was a matter of the Style > Render Type in the Layer Properties.

screenshot of the Layer Properites > Style > Render Type window

I had to manually adjust the values. I went through and deleted everything I didn't want. In order to do that, I had to use the Raster Information took from the Processing toolbox. Once I knew what values were actually represented in the raster, I went to the list of values and deleted everything not in my list of interested values. Then I manually changed the colors to tell the ranges apart better.

enter image description here

Your Answer

By clicking “Post Your Answer”, you agree to our terms of service and acknowledge you have read our privacy policy.

Not the answer you're looking for? Browse other questions tagged or ask your own question.