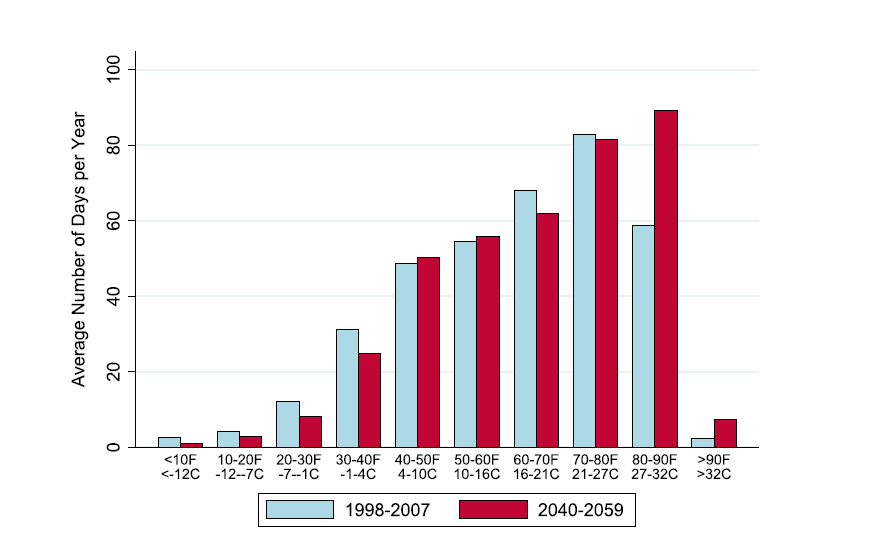
I have raster gridded data of Germany historical daily temperature observation (15 years' historical daily mean temperature observation) in RasterBrick object. Here is how my raster gridded data look like:
> Deu_crop
class       : RasterBrick
dimensions  : 31, 37, 1147, 5479  (nrow, ncol, ncell, nlayers)
resolution  : 0.25, 0.25  (x, y)
extent      : 5.75, 15, 47.25, 55  (xmin, xmax, ymin, ymax)
coord. ref. : +proj=longlat +datum=WGS84 +ellps=WGS84 +towgs84=0,0,0
data source : in memory
names       : X1980.01.01, X1980.01.02, X1980.01.03, X1980.01.04, X1980.01.05, X1980.01.06, X1980.01.07, X1980.01.08, X1980.01.09, X1980.01.10, X1980.01.11, X1980.01.12, X1980.01.13, X1980.01.14, X1980.01.15, ...
min values  :       -9.24,      -11.32,      -12.05,      -14.12,       -7.91,       -6.35,       -6.74,       -7.77,       -9.79,      -10.17,      -12.20,      -14.90,      -15.68,      -15.61,      -15.22, ...
max values  :        2.19,        0.68,        0.30,        2.91,        5.25,        5.03,        4.33,        3.40,        1.52,        0.33,       -1.10,       -1.61,       -3.55,       -0.12,        0.19, ...
Here is a reproducible example for multi-layer raster data which has similar structure with my actual multiple layers raster:
r <- raster(xmn=5.75, xmx= 15, ymn = 47.25, ymx =55,res=c(0.25,0.25))
temp_data <- do.call(stack,lapply(1:5479,function(i) setValues(r,round(runif(n = ncell(r),min = -10,max = 25)))))
names(temp_data) <- paste0('X',gsub('-','.',ymd('1980.01.01') + days(1:5479)))
Here is Germany' administrative shapefile that taken from eurostat: Germany' shapefile on the fly.
deu_shp <- shapefile('eurostat_NUTS3/deu_adm_2006.shp')
deu_extr <- raster::extract(temp_data ,deu_shp )
However, I intend to discretize the annual distribution of daily temperature into a fixed set of temperature bins (I need 10 bins in total for each year). To do so, I need to find maximum and minimum temperature value over multiple layers raster data, then design equally divided temperature range interval as bins for each year in each polygon.
desired output:
I need to fetch the polygons with top 3 high-temperature observation (1st highest, 2nd highest, 3rd highest temperature record) with plain tabular data. I mean, first let create 10 fixed set of bins for each year in each polygon all over multi-layers rater, then pick up the polygon with top 3 highest temperature record with bins value.
Here is the example output that I want to produce in my final result:
year Bin1;Bin2;Bin3;Bin4;Bin5;Bin6;Bin7;Bin8;Bin9;Bin10; NUTS_ID

1980    0   0   9   25  90  80  103 54  5   0   DE12A
1981    0   0   2   44  77  55  121 54  12  0   DE12A
1982    0   0   3   19  89  92  67  76  19  0   DE12A
1983    0   0   3   33  73  85  81  65  21  4   DE12A
1984    0   0   0   27  103 81  96  52  6   1   DE12A
1985    0   5   16  31  68  78  89  70  8   0   DE12A
1986    0   1   14  30  70  84  89  61  16  0   DE12A
1987    1   2   9   36  67  88  87  54  21  0   DE12A
1988    0   0   1   12  90  80  104 65  14  0   DE12A
1989    0   0   0   9   83  86  94  80  13  0   DE12A
1990    0   0   0   10  77  94  102 63  19  0   DE12A
1991    0   1   4   31  76  90  73  69  20  1   DE12A
1992    0   0   1   17  78  101 67  77  24  1   DE12A
1993    0   0   6   24  75  83  102 63  12  0   DE12A
1994    0   0   0   15  63  106 90  60  31  0   DE12A
1980    0   0   10  27  80  82  97  63  7   0   DE211
1981    0   0   15  30  72  53  107 67  21  0   DE211
1982    0   2   12  18  78  89  52  87  27  0   DE211
1983    0   0   6   34  65  75  83  61  37  4   DE211
1984    0   0   6   19  105 65  97  64  9   1   DE211
1985    3   5   17  30  76  60  77  79  18  0   DE211
1986    0   0   12  30  80  68  82  65  28  0   DE211
1987    0   5   10  35  65  81  80  70  19  0   DE211
1988    0   0   0   12  96  65  91  82  19  1   DE211
1989    0   0   0   27  65  88  88  78  19  0   DE211
1990    0   0   1   24  62  94  86  74  24  0   DE211
1991    0   1   11  31  78  71  78  70  24  1   DE211
1992    0   0   0   21  88  83  59  83  28  4   DE211
1993    0   0   7   30  71  72  84  82  19  0   DE211
1994    0   0   0   16  53  107 81  60  45  3   DE211
basically, I want to see where top three hottest temperature over whole germany, so I want to have tabular data with 10 fixed set of bins. Perhaps, simplest statistics on multi-layers raster data would be enough. Any idea?
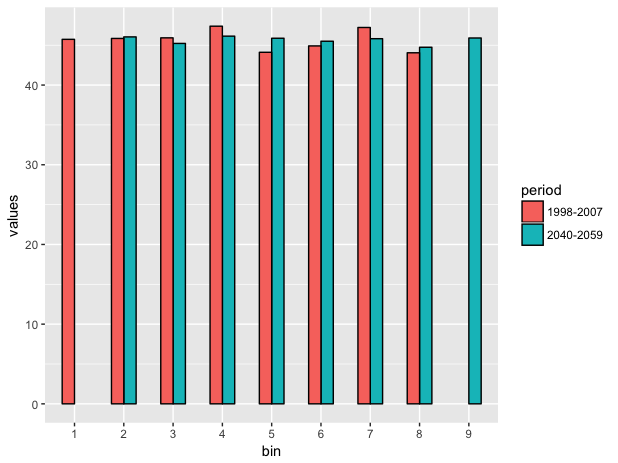
Here is the likely plot of fixed temperature bins for discretized annual distribution of daily temperature observation for each year:
Any way to make this happen in R?


