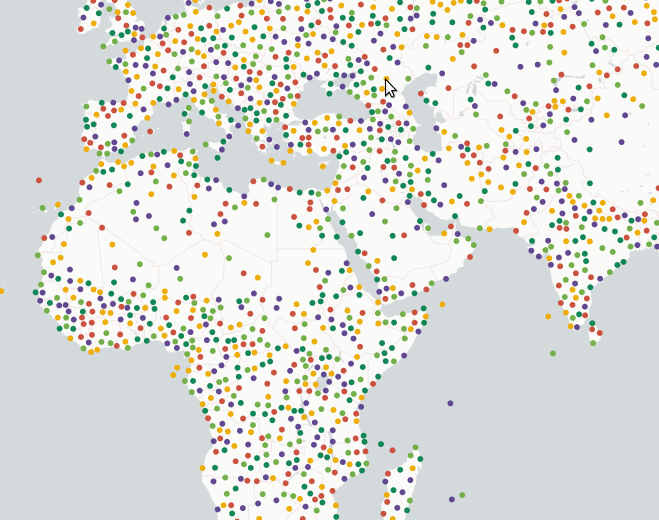
I have a shapefile for all US ZCTAs. Each ZCTA has been clustered by proximity and given a value in a new column called Zip_Rollup.
I am trying to add a style by value using the Zip_Rollup values. This works great except that it only allows 11 unique values and the rest are lumped as “others” with the same color making it hard to distinguish them as unique regions.
Zip_Rollup has 1000 + unique values which I would like to visualize.
It’s fine if there are duplicate colors. Is there a way to apply a random color to polygon fill by value in Carto, or other option to solve this problem?
I found a similar question with answer for Cartodb at the link below, but could not translate this to Carto myself.
Automatically coloring a large number of polygons in CartoDB

