I want to know how to select values from the xarray DataArray based on the location (geo_df.geometry) and time (geo_df.plant_date & geo_df.cut_date) of rows in the geopandas GeoDataFrame. I want to join them as 'features' in an output GeoDataFrame.
My datasets:
Packages I'm using:
import numpy as np
import pandas as pd
import geopandas as gpd
import matplotlib.pyplot as plt
from shapely import geometry
import xarray as xr
I have a geodataframe storing lat/lon POINTS which corresponds to households. The index column is the id of the households.
geo_df.head()

Out[]:
  crop_name     xxx     cut_date plant_date                       geometry
0   SORGHUM  0.061029 2011-11-10 2011-11-10 POINT (37.89087631 14.35381619)
1    MILLET -0.104342 2011-10-19 2011-10-19 POINT (37.89087631 14.35381619)
2   SORGHUM -0.031697 2013-11-26 2013-11-26 POINT (37.89087631 14.35381619)
I have an xarray object storing GRIDDED vegetation health data (NDVI).
ndvi_df = xr.open_dataset(geo_data_dir+ndvi_dir).ndvi

Out[]: <xarray.DataArray 'ndvi' (time: 212, lat: 200, lon: 220)>
[9328000 values with dtype=float32]
Coordinates:
  * lon      (lon) float32 35.024994 35.074997 35.125 35.174988 35.22499 ...
  * lat      (lat) float32 14.974998 14.924995 14.875 14.824997 14.775002 ...
  * time     (time) datetime64[ns] 2000-02-14 2000-03-16 2000-04-15 ...
Attributes:
    long_name:   Normalized Difference Vegetation Index
    units:       1
    _fillvalue:  -3000
I have a geodataframe storing a POLYGON which corresponds to a country.
world = gpd.read_file(gpd.datasets.get_path('naturalearth_lowres'))
ethiopia = world.loc[world["name"] == "Ethiopia"]
Visual Summary:
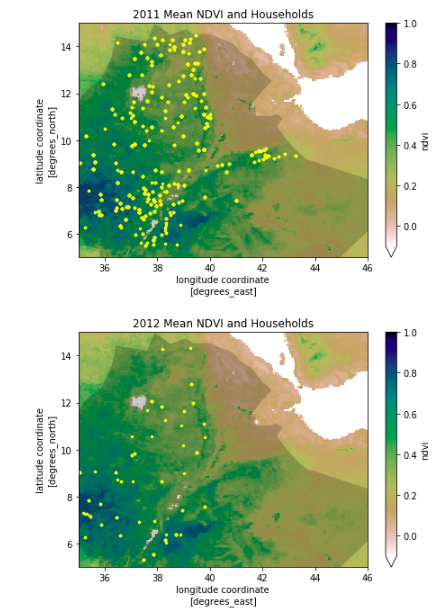
My datasets plotted on top of one another look as follows (plotted annually for demonstration purposes).
(ndvi_df.loc[f'{year}-01-16T00:00:00.000000000':f'{year}-12-16T00:00:00.000000000']
 .mean(dim='time')
 .plot(cmap='gist_earth_r', vmin=-0.1, vmax=1)
)

ax = plt.gca()

ethiopia.plot(alpha=0.2, color='black', ax=ax)

(geo_df
 .loc[ (lsms_geo_1["cut_date"] > f'{year}-01-01') & (lsms_geo_1["cut_date"] < f'{year+1}-01-01') ]
 .plot(markersize=6 ,ax=ax, color="#FEF731")
)
ax.set_title(f'{year} Mean NDVI and Households')
plt.show()
Ideal Output:
I want as an output, a geodataframe with extra columns telling me the NDVI values in the PRECEDING MONTHS for the pixel which the households are inside.
The index column is the id of the households.
like this:
  crop_name     xxx     cut_date plant_date                       geometry  ndvi_month_0  ndvi_month_1  ndvi_month_2
0   SORGHUM  0.061029 2011-11-10 2011-11-10 POINT (37.89087631 14.35381619)          0.3           0.3           0.3
1    MILLET -0.104342 2011-10-19 2011-10-19 POINT (37.89087631 14.35381619)          0.6           0.6           0.6
2   SORGHUM -0.031697 2013-11-26 2013-11-26 POINT (37.89087631 14.35381619)          0.1           0.1           0.1
I would also like to know how to subset my data in xarray object by using the geodataframe polygon ethiopia.
NOTE: Reposted from stack overflow here because it seems a GIS related question.

