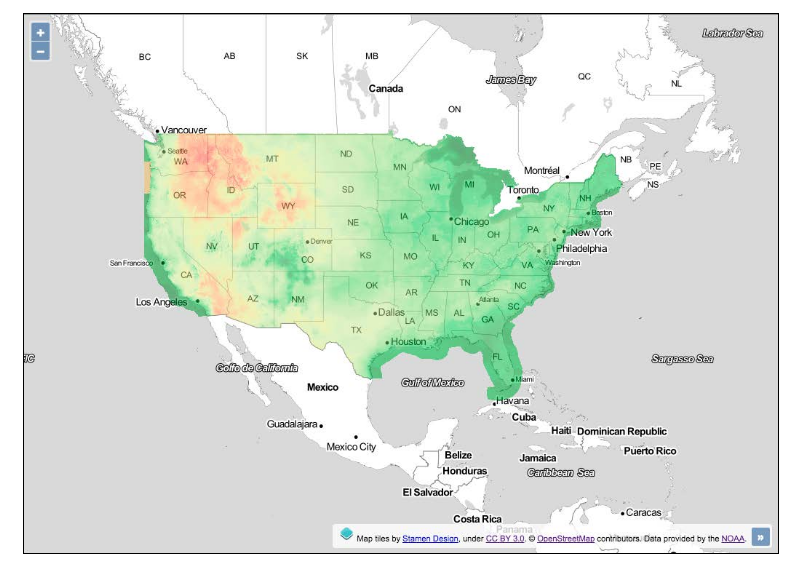
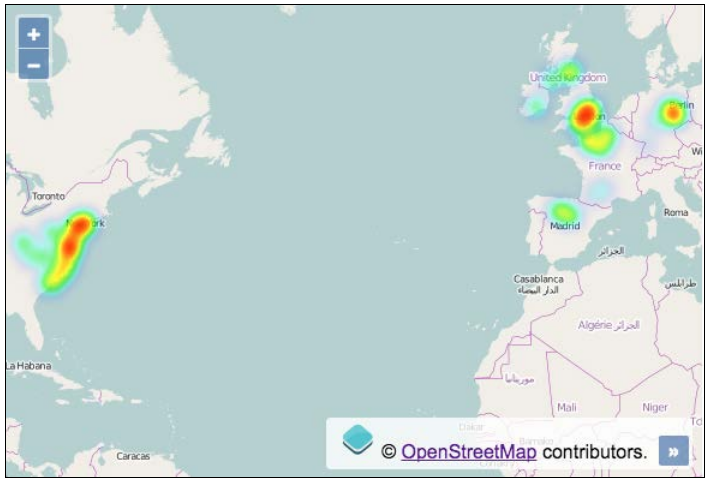
I am new on Leaflet/OpenLayers. I have been searching the internet for a way to create a temperature map like the one below, but I didn't succeed...the only thing I made was a classical heatmap, but not even closer to this example.
This is the scenario:
- I have 5100 coordenates (longitude, latitude, metric)
- This metric varies from 0 to 1
I want to implement a temperature map like the one below(from openlayers 3 cookbook):
I'm not looking for a 'ready to go' tool or a straightforward answer, I just want a 'direction'.
What I have implemented so far looks like this(completely different from the one above):


