0

i want to change the resolution of elevation data for several countries and them merge those in one rasterlayer. I use getData function from raster package. I tried this one:

library(raster)
library(dplyr)
library(purrr)

eu = c("Italy","Spain")

eu_alt = eu %>% 
        map(~ {.x = getData("alt", country = .x)}) %>%   # Get elevation
        map(~ aggregate(.x, fact=5, fun=mean)) %>%       # Change the resolution 
        map(~ as.data.frame(.x, xy=TRUE))  %>%           # Convert to df
        map(~ na.omit(.x)) %>%                           # Omit NA
        reduce(full_join, by=c("x","y"))                 # Merge df

eu_alt = rasterFromXYZ(eu_alt)

But it does not work right; converting to dataframe does not seem to be the right approach. What i want is to get something like that:

class       : RasterBrick 
dimensions  : 1417, 79993, 113350081, 2  (nrow, ncol, ncell, nlayers)
resolution  : 0.0003472222, 0.008333333  (x, y)
extent      : -9.296007, 18.47934, 35.29167, 47.1  (xmin, xmax, ymin, ymax)
coord. ref. : NA 
data source : in memory
names       : ITA_msk_alt, ESP_msk_alt 
min values  :       -5.72,       -4.00 
max values  :    3972.077,    2919.840 

i mean a rasterlayer with changed resolution where nlayers stand for country-specific data. What would be the easiest way to do it?

3
  • You need to specify all the packages you are using, because at the moment your code does not run.
    – Spacedman
    Commented Oct 4, 2018 at 10:43
  • sorry for that. i edited it.
    – Anton
    Commented Oct 4, 2018 at 11:23
  • Another tip: don't use library(tidyverse), instead only call up packages you actually use. This looks like dplyr and purrr.
    – Spacedman
    Commented Oct 4, 2018 at 11:55

2 Answers 2

0

If you want to resample each country onto a common grid that stretches over their whole extent but still keep that data in separate layers, this will work:

library(raster)
library(dplyr)
library(purrr)

Just get the raw data, no need to aggregate yet:

eu     <- c("Italy","Spain")
eu_alt <- map(eu, ~ {.x = getData("alt", country = .x)})

Calculate the combined extent of all rasters in list:

eu_alt_xt <- map(eu_alt, extent) %>%
  map(as.vector) %>%
  transpose() %>%
  map(unlist) %>%
  map2_dbl(seq_along(.), ., function(index, data) {
    # even-number-indexed list items are xmax, ymax
    if(index %% 2 == 0) { max(data) } else { min(data) }
  }) %>%
  extent

make a blank raster at the target resolution and extent:

blr <- raster(eu_alt_xt, resolution = 0.04, crs = '+init=EPSG:4326')

Note this still works pretty fast at the original data's resolution, so you can change resolution = 0.04 to e.g. resolution = res(eu_alt[[1]]) without a problem.

Anyway, resample each country onto the blr grid and brick the result:

eu_rs_brick <- map(eu_alt, resample, y = blr) %>% brick

To collapse that to a single layer,

eu_rs_raster <- calc(eu_rs_brick, mean, na.rm = TRUE) 

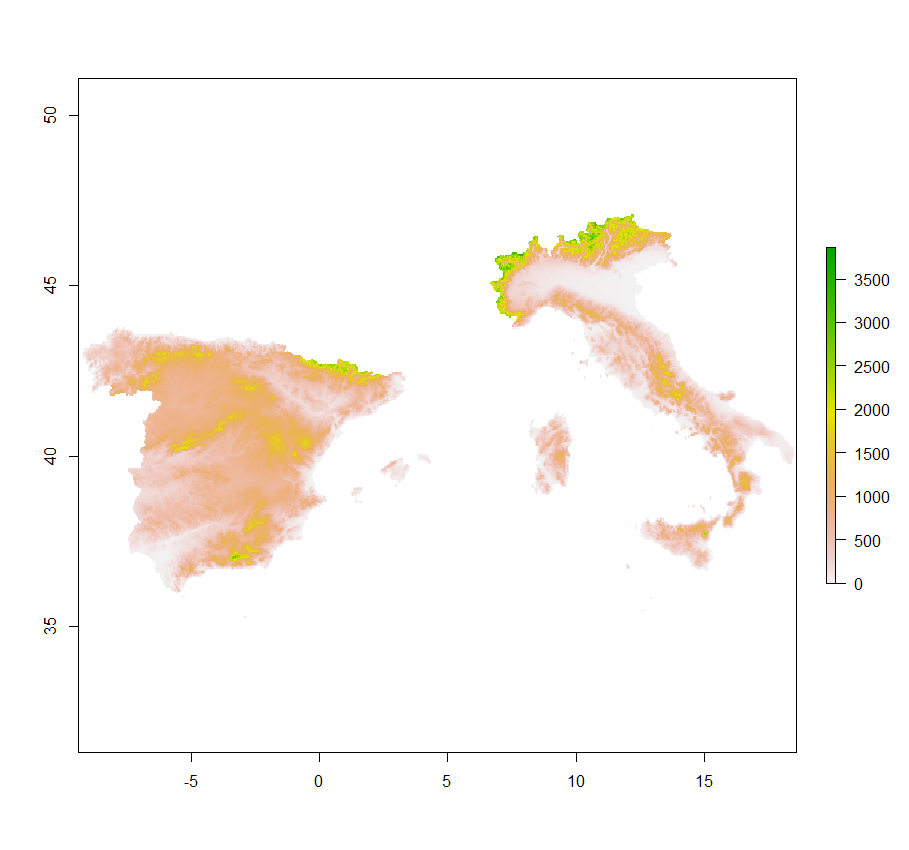
plot(eu_rs_raster)

enter image description here

Don't bother converting raster data to a data.frame unless you're sending it to ggplot, it'll just slow you down.

0

The grid basis of your two data frames are not equivalent. If you sort the data frame produced at the end of your percentage sandwich (and before you try rasterFromXYZ) by X coordinate and look at this slice you will see:

> eu_alt = eu_alt[order(eu_alt$x),]
> eu_alt[31155:31164,]
             x        y ITA_msk_alt ESP_msk_alt
38427 4.287500 39.92083          NA    35.27273
38609 4.287500 39.87917          NA    30.85000
38792 4.287500 39.83750          NA    41.70588
38610 4.329167 39.87917          NA    13.00000
5014  6.645833 45.09583    2287.667          NA
4878  6.687500 45.13750    2303.400          NA
5015  6.687500 45.09583    1761.880          NA
5152  6.687500 45.05417    1706.318          NA
5291  6.687500 45.01250    2257.000          NA
4879  6.729167 45.13750    2590.800          NA

The first four are the most easterly points on the Spain grid. The next ones are the most westerly points of France. The difference between them is 2.31666667, which is not a nice multiple of the resolution of either grid:

> (6.645833 - 4.329167)/0.0416666667
[1] 55.59998

If this was a whole number then the X coords of Italy and Spain are on the same grid. But it isn't, so they're not. So to create the merged grid with rasterFromXYZ, R has to create an even finer grid so that the points from Italy and the points from Spain are all snapped to it.

Possible solutions:

  1. Find a Europe-wide DEM in a single file.
  2. Create a Europe-wide grid and transform the country data onto that grid.

Your Answer

By clicking “Post Your Answer”, you agree to our terms of service and acknowledge you have read our privacy policy.

Not the answer you're looking for? Browse other questions tagged or ask your own question.