0

I have a KML file which was created using Google's My Maps.

The original file can be downloaded here: Google My Maps

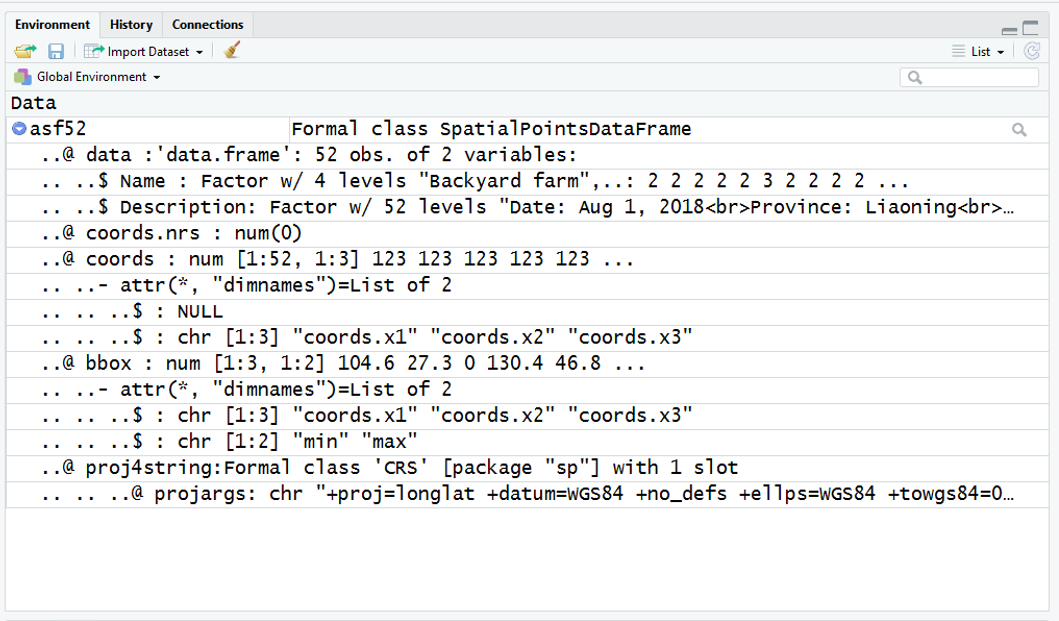
Using R, I can import this using the "readOGR" function of the rgdal library This brings the KML file in as a SpatialPointsDataFrame (SPDF) - which i am calling asf52

![RStudio Data Pane

In this SPDF, the spatial data is contained under @coords and is readily extracted into a dataframe using code like

df  <- data.frame(asf52@coords[,1:2])

However, I am struggling to come up with a way to neatly extract the the non-spatial data - contained under @data$Description - and turn it into a dataframe with a column for each variable.

2 Answers 2

1

You don't need to call data.frame() around the extract - the @data slot already is a data.frame. Just do

  df <- asf52@data

to pull out a copy. That said, you may be better served by using the newer sf library for this task:

library(sf)
ob_kml <- file.path(getwd(), 'Outbreaks 56 (OIE).kml')    

There is more than one layer in your KML - list them with e.g.

st_layers(ob_kml)

Use read_sf() with the layers argument to choose your point data specifically and read it in. read_sf() defaults to stringsAsFactors = FALSE which may be preferable.

asf_c <- read_sf(ob_kml, layer = 'ASF in China.xlsx')

To get a plain dataframe, just drop the geometry as follows:

asf_c_df <- st_set_geometry(asf_c, NULL)

EDIT: I see your secondary issue now; it looks like neither sf nor sp look at the <ExtendedData> tags that hold the attribute data you want (open the KML in Notepad++ if you want to see what I mean). QGIS does detect and import them as separate attribute columns, so @Jella's advice is sound. I'm not sure if the issue here lies with sf/sp or GDAL, but it may be worth raising an issue of the sf github page.

In the meantime, your instinct to go with tidyr functions is sound, its just a little tricky to get a clean separation. The following looks pretty good:

asf_c_df <- st_set_geometry(asf_c, NULL) %>%
  # remove duplicate <br> tags
  dplyr::mutate(Description = gsub('<br><br>', '<br>', Description)) %>%
  # split on <br>
  tidyr::separate(., col = Description, 
                  into = c('Date', 'Province', 'City', 'County', 'Location', 
                           'Total_herd_size', 'Affected_animals', 'Deaths',
                           'Culled', 'Latitude', 'Longitude', 'Source'), 
                  sep = '<br>') %>%
  # ditch the key: part of key: value
  dplyr::mutate_all(., funs(gsub('^.*: ', '', .))) %>%
  # data type fixes 
  dplyr::mutate_at(vars(7:10), as.integer) %>%
  dplyr::mutate_at(vars(11,12), as.numeric) %>%
  # bonus points: proper dates. First, fix September, then cast to Date datatype
  dplyr::mutate(Date = gsub('Sept', 'Sep', Date),
                Date = as.POSIXct(Date, format = '%b %d, %Y')) %>%
  # double bonus! proper NA for missing data
  dplyr::mutate_if(is.character, funs(ifelse(. == '', NA, .)))
7
  • 1
    Thank you for your detailed suggestions, all of which I have followed. However, the problem remains in that all the description data is placed into one column. This seems to be a limitation of how both read_sf() and readOGR() are handling the KML file, and thus I will need to wait until this is changed to accommodate this format. In the meantime, I will explore post-import parsing of the column using functions like separate() in the tidyr package. Commented Nov 5, 2018 at 16:02
  • The issue lies in the KML file as all the informatio is stored in the description to show a nice pop-up in a GIS viewer. KML files are not able to store a proper attribute table.
    – Jelle
    Commented Nov 6, 2018 at 10:55
  • Well spotted, @Jelle, the issue is both sp and sf fail to parse the KML structure completely.
    – obrl_soil
    Commented Nov 6, 2018 at 11:43
  • @obrl_soil, When I open the KML file in Google Earth, you get the same issue. So I think it's rather the limitation of (this particular) kml file than an issue with the sp or sf package.
    – Jelle
    Commented Nov 6, 2018 at 11:46
  • @Jelle I'm not so sure - my first instinct was to blame the GDAL kml driver, but QGIS should be using that too, and its doing the right thing...
    – obrl_soil
    Commented Nov 6, 2018 at 11:58
0

Like what you did with @coords, use asf52@data to extract the non-spatial data through a dataframe. You can call the description column through asf52@data$description

7
  • Yes this is what I tried, i.e.: df_2 <- data.frame(asf52@data$Description). The code runs, but the result is all the data is put into a single column. Commented Nov 4, 2018 at 21:56
  • You mean both ‘name’ and ‘description’?
    – Jelle
    Commented Nov 4, 2018 at 21:58
  • Yes - both the name and the data are concatenated into a single column. This is the result of running str(df_2): 'data.frame': 52 obs. of 1 variable: $ asf52.data.Description: Factor w/ 52 levels "Date: Aug 1, 2018<br>Province: Liaoning<br>City: Shenyang<br>County: Shenbei New District<br>Location: Shenbei "| truncated,..: 1 12 14 13 15 2 3 5 4 6 ... Commented Nov 4, 2018 at 22:03
  • The data frame returns 1 variable, being $description. What do you see if you observe the data.frame through View(asf52)?
    – Jelle
    Commented Nov 4, 2018 at 22:29
  • All the description data is in one column. If I run 'head(asf52$Description, n=2)' - to show the first two rows - I get: [1] "Date: Aug 1, 2018<br>Province: Liaoning<br>City: Shenyang<br>County: Shenbei New District<br>Location: Shenbei Street<br>Total herd size: 19420<br>Affected animals: 47<br>Deaths: 47<br>Culled: 19373<br>Latitude: 42.0225<br><br>Longitude: 123.2932<br>Source: OIE" [2] "Date: Aug 7, 2018<br>Province: Liaoning<br>City: Shenyang<br>County: Shenbei New District<br>Location: Cailuo Yi Village<br>Total herd size: 160<br>Affected ....... Commented Nov 4, 2018 at 23:55

Your Answer

By clicking “Post Your Answer”, you agree to our terms of service and acknowledge you have read our privacy policy.

Not the answer you're looking for? Browse other questions tagged or ask your own question.