1

How does exactly the krige function (a wrapper to gstat and predict functions) from package gstat calculate kriging variance (minimized estimation variance) in Ordinary Kriging?

I wanted to reproduce in R results from How to make a prediction in Kriging using a semivariogram? (prediction equal to 6.88 and kriging variance equal to 3.14). Here is the R code for the same set of points and covariance function.

library(gstat)
library(sp)

p = SpatialPoints(cbind(c(0,0,3),c(0,2,1)))
p$z = c(10,7,3)
krige(z~1, p, SpatialPoints(cbind(1,1)), vgm(psill=3, nugget=1, range=6, "Exp"))

#Results
[using ordinary kriging]
  coordinates  var1.pred var1.var
1      (1, 1)  6.813431  2.002507

The prediction result is close (6.88 versus 6.81), but the kriging variance is very different (3.14 versus 2, even though the variance unit is squared which partially explains a greater difference).

The example I used in the linked post was made up, yet I also have tested examples from two other sources and was not able to reproduce results with krige as well (though results were a little more proximate than mine). What am I missing?

The equation used to calculate the kriging variance in the example was:

σ²ε = sill - [w1 ... wn λ] [C10]
                           |...|
                           |Cn0|
                           [1  ]

where σ²ε is the kriging variance, sill is the variogram sill parameter, wn the kriging weight of sample point n , λ is the Lagrange multiplier, Cn0 is the covariance between sample point n and prediction point.

A bonus question is, should the predicted values (6.88 versus 6.81) have been the same as well?

Looking at krige and predict source codes did not help because they are over my head.

0

1 Answer 1

3

I think there's a difference in the variogram between the model fitted here with gstat and the one in the linked question.

In the linked question, the model is expressed in terms of the covariance as C:

C(h) = σ² = 4, if |h| = 0
C(h) = (σ² - a)exp(-3|h|/r) = (4 - 1)exp(-3|h|/6), if |h| > 0

In R,

C = function(h){3*exp(-3*h/6)}

And the variogram from that covariance is σ²-C(h):

VC = function(h){4-C(h)}

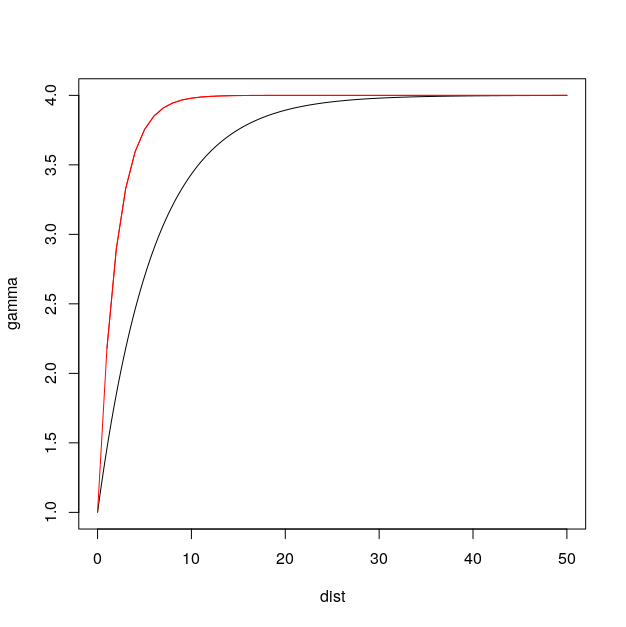
Compare that with the variogram from gstat:

VCgstat = vgm(psill=3, nugget=1, range=6, "Exp")
plot(variogramLine(VCgstat,maxdist=50), type="l")
lines(0:50, VC(0:50), col="red")

enter image description here

I suspect this difference is a difference in the definition of "range" for the model. I don't think there is a clear agreement on the meaning of "range" for exponential variograms.

A little experimenting with the range parameter of the gstat model shows it is exactly equal to the VC function when range=2:

VCgstat2 = vgm(psill=3, nugget=1, range=2, "Exp")

And if I krige using that I get close agreement with the linked post:

> krige(z~1, p, SpatialPoints(cbind(1,1)), vgm(psill=3, nugget=1, range=2, "Exp"))
[using ordinary kriging]
  coordinates var1.pred var1.var
1      (1, 1)  6.887426 3.136307

I'm not sure where this change has come from - possibly there's a multiply by sigma-squared minus 1 that shouldn't be there - but you should always carefully read (and then check!) the meaning of all parameters.

1
  • 1
    You nailed it. vgm takes the exponential model as C(h) = (σ² - a)*exp(-|h|/r) (or S(h) = a + (σ² - a)*(1-exp(-[h]/r)), i.e., 'range' is approximate one third from the dist where the variogram curve flattens. See gis.stackexchange.com/questions/153931/…. Thank you. Commented Nov 21, 2018 at 12:30

Your Answer

By clicking “Post Your Answer”, you agree to our terms of service and acknowledge you have read our privacy policy.

Not the answer you're looking for? Browse other questions tagged or ask your own question.