Your link didn't work for me, but this shows green lines:
https://earthquake.usgs.gov/arcgis/rest/services/ls/pwfdf_2018/MapServer/export?dynamicLayers=[{"id":6,"name":"Segment Combined Hazard Estimates","source":{"type":"mapLayer","mapLayerId":6},"definitionExpression":"combhazcl = 3","drawingInfo":{"renderer":{"type":"uniqueValue","field1":"combhazcl","field2":null,"field3":null,"fieldDelimiter":",","defaultSymbol":null,"defaultLabel":null,"uniqueValueInfos":[{"value":"1","symbol":{"color":[255,255,0,255],"width":2,"type":"esriSLS","style":"esriSLSSolid"},"label":"Low"},{"value":"2","symbol":{"color":[255,170,0,255],"width":2,"type":"esriSLS","style":"esriSLSSolid"},"label":"Moderate"},{"value":"3","symbol":{"color":[76,230,0,255],"width":2,"type":"esriSLS","style":"esriSLSSolid"},"label":"High"}]}},"minScale":0,"maxScale":0}]&dpi=96&transparent=true&format=png32&layers=show:6&bbox=-13232868.053459939,4031991.7385576465,-13210548.441200696,4044546.5204534694&bboxSR=102100&imageSR=102100&size=1168,657&layerDefs={"6":"combhazcl = 3"}&f=image
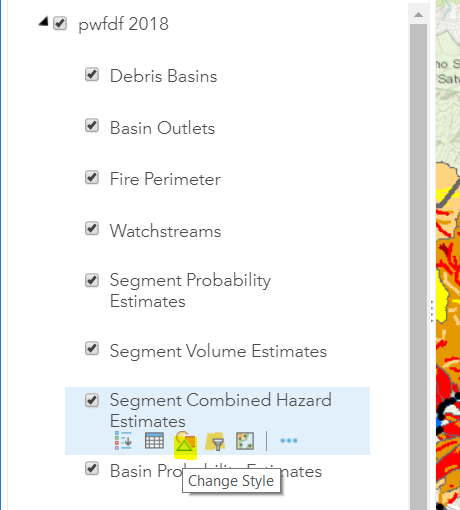
I got this by making an ArcGIS online webmap (http://arcg.is/18a0fz), and editing there:

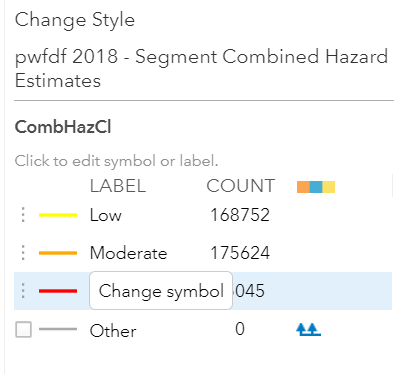
Then change symbol:

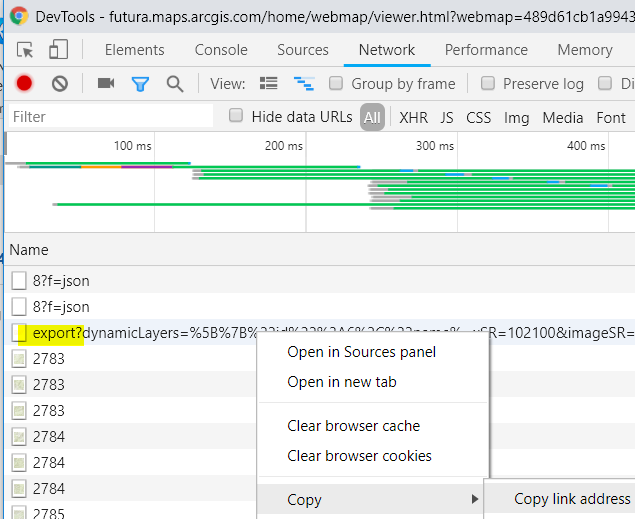
Then OK, then DONE, then right click and copy export url in the Chrome Devtools.

Then paste into https://www.urldecoder.org/ and click decode.
That gave me a decypherable url.
https://earthquake.usgs.gov/arcgis/rest/services/ls/pwfdf_2018/MapServer/export?dynamicLayers=[{"id":6,"name":"Segment Combined Hazard Estimates","source":{"type":"mapLayer","mapLayerId":6},"drawingInfo":{"renderer":{"type":"uniqueValue","field1":"combhazcl","field2":null,"field3":null,"fieldDelimiter":",","defaultSymbol":null,"defaultLabel":null,"uniqueValueInfos":[{"value":"1","symbol":{"color":[255,255,0,255],"width":2,"type":"esriSLS","style":"esriSLSSolid"},"label":"Low"},{"value":"2","symbol":{"color":[255,170,0,255],"width":2,"type":"esriSLS","style":"esriSLSSolid"},"label":"Moderate"},{"value":"3","symbol":{"color":[56,168,0,255],"width":2,"type":"esriSLS","style":"esriSLSSolid"},"label":"High"}]}},"minScale":0,"maxScale":0}]&dpi=96&transparent=true&format=png32&layers=show:6&bbox=-13230130.055220343,4034436.016786233,-13218970.249090724,4040713.407734145&bboxSR=102100&imageSR=102100&size=1168,657&f=image
The part of interest is json after the dynamicLayers, so I used https://jsonformatter.curiousconcept.com/ to format it:
[
   {
      "id":6,
      "name":"Segment Combined Hazard Estimates",
      "source":{
         "type":"mapLayer",
         "mapLayerId":6
      },
      "drawingInfo":{
         "renderer":{
            "type":"uniqueValue",
            "field1":"combhazcl",
            "field2":null,
            "field3":null,
            "fieldDelimiter":",",
            "defaultSymbol":null,
            "defaultLabel":null,
            "uniqueValueInfos":[
               {
                  "value":"1",
                  "symbol":{
                     "color":[
                        255,
                        255,
                        0,
                        255
                     ],
                     "width":2,
                     "type":"esriSLS",
                     "style":"esriSLSSolid"
                  },
                  "label":"Low"
               },
               {
                  "value":"2",
                  "symbol":{
                     "color":[
                        255,
                        170,
                        0,
                        255
                     ],
                     "width":2,
                     "type":"esriSLS",
                     "style":"esriSLSSolid"
                  },
                  "label":"Moderate"
               },
               {
                  "value":"3",
                  "symbol":{
                     "color":[
                        56,
                        168,
                        0,
                        255
                     ],
                     "width":2,
                     "type":"esriSLS",
                     "style":"esriSLSSolid"
                  },
                  "label":"High"
               }
            ]
         }
      },
      "minScale":0,
      "maxScale":0
   }
]


