1

I'd like to make a map that shows the amount of fog by San Francisco neighborhood.

I'm using QGIS. I have some of the pieces:

  • a geoJSON file for each of the neighborhoods.
  • a raster map with a shapefile for the fog belt zones
  • a vector file for the contours generated by the fog belts
  • a map that shows the average number of hours for the Bay Area

My goal would be something like this, where each neighborhood has one value for the average summertime hours of fog & low clouds per day in that neighborhood -

https://i.sstatic.net/tKL2x.jpg

I'm not sure how to read the raster map of fog belt zones. My understanding is that the area between each of the contours indicates how much fog is expected in that geographic space.

It's unclear to me how to turn that into something more readily understandable, like the map I linked above.

How do I translate the fog belt zones file into expected fog in geographic space?

1
  • What GIS software do you want to use? The rules of this site do not allow you to "leave your options open" by asking for answers in many different software packages. Or you can tag your question as "gis-principle" in which case you may get a very theoretical answer which would be difficult to implement.
    – csk
    Commented Feb 8, 2019 at 21:11

1 Answer 1

2

Two of the available rasters are "Decadal Daytime & Nighttime (average day/night for all 4 summer months over all available years)". If I correctly understand the provided description, you want the daytime version of this raster. Once you download all the rasters, the daytime decadal average fog raster is in this folder: decadal_rasters\decadal_rasters\flcc_deca_day. Unzip the folder and add the raster to your QGIS project.

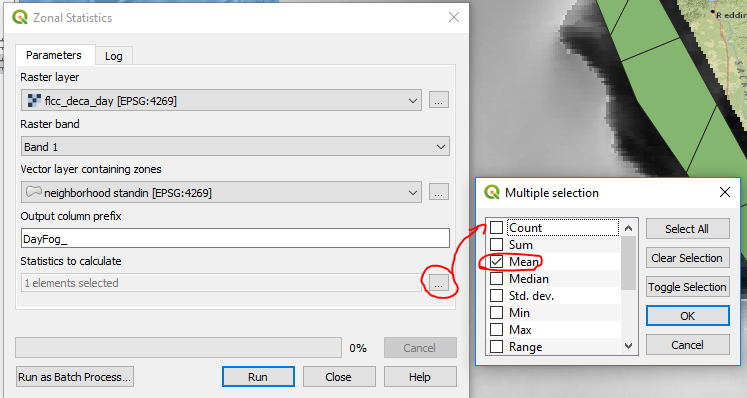
Use the Zonal Stats tool (found in the Processing Toolbox) to calculate the average hours of daytime fog in each neighborhood. (I assume you want the mean, but mode and median are also possible). Enter an understandable column name where the tool says "output column prefix," eg "DayFog_".

enter image description here

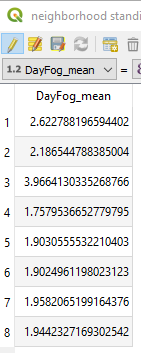
Open the attribute table for the neighborhood layer. There should be a new column called "DayFog_Mean." Make sure that this column exists and has reasonable numbers in it. (I used a made-up layer instead of the actual neighborhood layer, so your numbers won't be the same as in the image.)

enter image description here

Style the neighborhood layer using a Categorized or Graduated style:

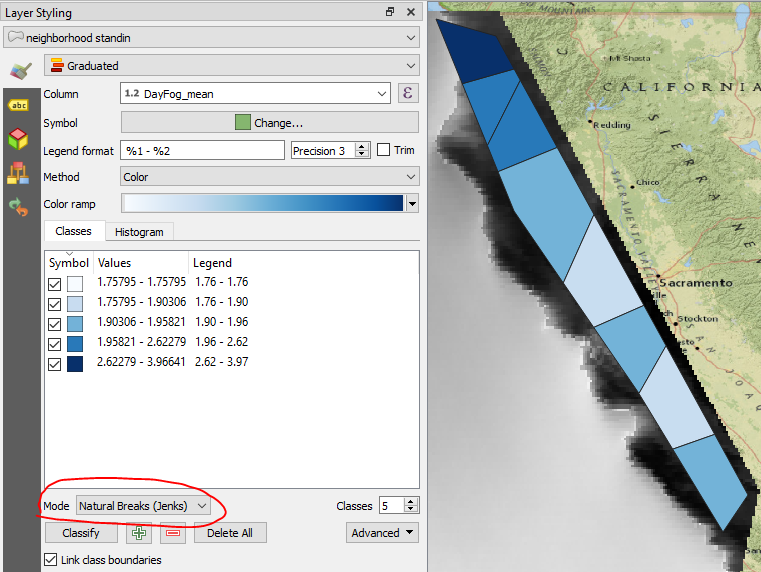
Open the Layer Styling panel, choose "Categorized" or "Graduated" style, Select the new column ("DayFog_Mean") from the dropdown menu, and click "Classify." Now you should have each neighborhood polygon color-coded based on its average.

enter image description here

If you choose to use "graduated" style, try out the different break modes to find one that suits your purpose.

3
  • Here's an answer that uses the raster layer. I think this method is easier than using the contours. To use the contours you would have to convert them into polygons, manually enter the number of hours of fog, intersect the fog polygons with the neighborhoods, and calculate an area-weighted average.
    – csk
    Commented Feb 8, 2019 at 22:11
  • This is highly informative. How do I get this to focus on just San Francisco?
    – Sebastian
    Commented Feb 19, 2019 at 18:02
  • If the neighborhood layer has a city field, you can apply a filter: gis.stackexchange.com/questions/25963/…. If you do this before running Zonal Stats, the output should include only SF neighborhoods. Or you can run Zonal Stats first, and filter the output afterwards.
    – csk
    Commented Feb 19, 2019 at 18:18

Your Answer

By clicking “Post Your Answer”, you agree to our terms of service and acknowledge you have read our privacy policy.

Not the answer you're looking for? Browse other questions tagged or ask your own question.