3

In my dataset of points, I need first to group points by ID, sort them by time and for each group to draw a line by time order. And for that processing algorithm points to path works perfectly. But my problem is that I lose all the attributes of points after running the algorithm. It would mean to me that at least ID of each group of points became ID for the corresponding line. I have some attributes that are for each group the same and it is really important not to lose them after running the algorithm.

In order to better understand my problem, my dataset looks like as:

ID      TIME        kv           X       Y
1        00:00      a2         x coord   y coord
1        00:05      a2         x coord   y coord
1        01:00      a2         x coord   y coord
1        03:00      a2         x coord   y coord
2        00:00      a6         x coord   y coord
2        17:00      a6         x coord   y coord
3        05:00      ab         x coord   y coord

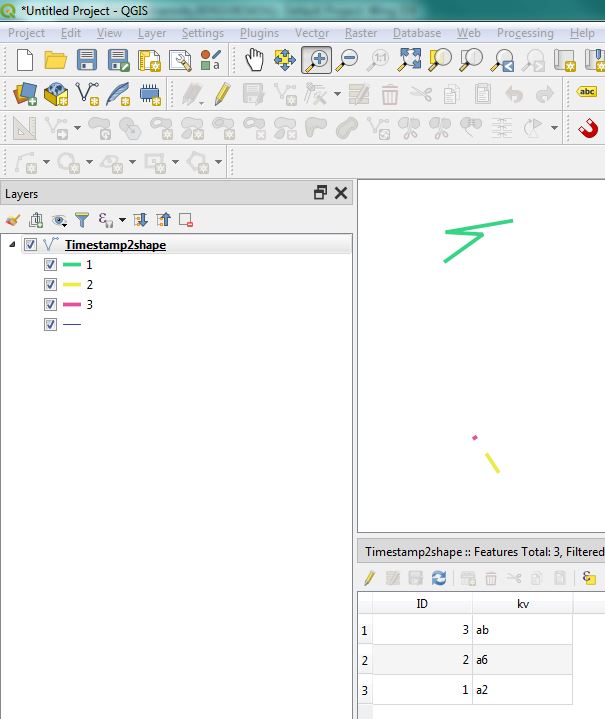
And my output should be the set of lines with the kv column, so for each user, I should have a line between points by time order:

ID    kv    GEOMETRY
1     a2         geom
2     a6         geom
3     ab         geom

And the real output in after finishing algortithm looks as this:

ID                  GEOMeTRY        
new-random-id1       line-geom         
new-random-id2       line-geom
new-random-id3       line-geom

Are there any alternative approaches?

12
  • This is a basic exercise in normalization. If it is not possible to merge your unvarying properties, then you need to choose one, then join back to the target.
    – Vince
    Commented Apr 28, 2019 at 15:32
  • Would using python pandas be an option?
    – Bera
    Commented Apr 28, 2019 at 16:00
  • Yeah, why not :)
    – Neven
    Commented Apr 28, 2019 at 18:12
  • And btw Vince, there is no normalization, this column weight and its numbers is just example here. I made it up.
    – Neven
    Commented Apr 28, 2019 at 18:14
  • 1
    Which qgis version are you using? Current releases keep the grouping field in the output. Are you using 2.18?
    – ndawson
    Commented Apr 29, 2019 at 21:22

1 Answer 1

2

You can use pandas. You will have to adjust the code to match your fieldnames, time format etc. To create lines you cant have only one entry, like your ID 3. If you do you will need to adjust the code.

Data in csv file:

ID,TIME,kv,X,Y
1,00:00,a2,587667.4987,6268456.463
1,01:00,a2,587667.4987,6270394.893
1,00:05,a2,590173.2747,6270253.057
1,03:00,a2,592064.4264,6271151.354
2,17:00,a6,590456.9474,6255454.795
2,00:00,a6,591166.1293,6254367.382
3,05:00,ab,589653.2079,6256636.765
3,02:00,ab,589600,6256600

Example code:

import pandas as pd
import geopandas as gpd
from shapely.geometry import Point, LineString

data = r'C:\Test\Timestamps2.csv'
df = pd.read_csv(data)

#Convert string/text/object time to datetime time
df['TIME'] = pd.to_datetime(df['TIME']).dt.time
df.sort_values(by='TIME', inplace=True)

#Create XY column
df['XY'] = list(zip(df['X'],df['Y']))

#Group by ID. Any aggfunc is possible, python build-in or own. Also possible to have multiple funcs per field.
aggfuncs = {'TIME':'first', 'kv':'first', 'XY':list}
df2 = df.groupby('ID').agg(aggfuncs)

#Create geodataframe
geometry = [LineString([Point(p) for p in row]) for row in df2['XY']]
crs = {'init':'epsg:3006'}
gdf = gpd.GeoDataFrame(df2, crs=crs, geometry=geometry)

#Export to file
gdf.reset_index(inplace=True) #To keep ID column
del gdf['XY']
del gdf['TIME']
gdf.to_file(r'C:\Test\Timestamp2shape.shp', driver="ESRI Shapefile")

enter image description here

Not the answer you're looking for? Browse other questions tagged or ask your own question.