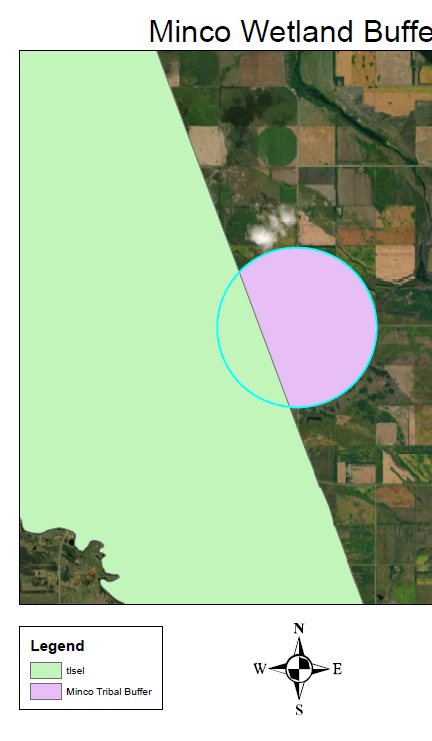
I've written a program that maps out a specific point file of interest. The program produces a map (clipped map attached below) but I can't figure out how to change the symbology to different colors. Is this possible? I've been looking through the arcpy.mapping library on ESRI and I haven't been able to find much on the subject.
if land_result == 1:
 with arcpy.da.SearchCursor(inFC, ['edited_nam', 'Field12']) as cursor:
  for x in cursor:
    print 'The %s %s contains tribal lands within its buffer zone' % (x[0], x[1])

  mxd = arcpy.mapping.MapDocument(r'P:/Python/topo_template.mxd')

  add_substation = arcpy.mapping.Layer(output_tribal_name)
  add_triballand = arcpy.mapping.Layer(triballands)

  df = arcpy.mapping.ListDataFrames(mxd, 'Data_Frame')[0]
  df.extent = add_substation.getExtent ()

  for df in arcpy.mapping.ListDataFrames(mxd):
    df.rotation = 0
    df.scale = 32000

  sub = arcpy.mapping.AddLayer(df, add_substation, 'AUTO_ARRANGE')
  wet = arcpy.mapping.AddLayer(df, add_triballand, 'AUTO_ARRANGE')

  north_arrow = arcpy.mapping.ListLayoutElements(mxd, 'MAPSURROUND_ELEMENT', 'North*')
  narrow = north_arrow[0]
  narrow.elementPositionX = 4.25
  narrow.elementPositionY = 1.25

  map_legend = arcpy.mapping.ListLayoutElements(mxd, 'LEGEND_ELEMENT', 'Map_L*')
  legend = map_legend[0]
  legend.elementPositionX = 0.5
  legend.elementPositionY = 1.33

  map_scale_bar = arcpy.mapping.ListLayoutElements(mxd, 'MAPSURROUND_ELEMENT', 'Scale*')
  scalebar = map_scale_bar[0]
  scalebar.elementPositionX = 4.25
  scalebar.elementPositionY = 0.33
  scalebar.elementWidth     = 3.75
  scalebar.elementHeight    = 0.3

  map_title = arcpy.mapping.ListLayoutElements(mxd, 'TEXT_ELEMENT', 'Map_T*')
  title = map_title[0]
  title.elementPositionX = 4.25
  title.elementPositionY = 10.75
  title.text = output + ' Wetland Buffer'

  map_data_frame = arcpy.mapping.ListLayoutElements(mxd, 'DATAFRAME_ELEMENT', 'Data_F*')
  dataframe = map_data_frame[0]
  dataframe.elementPositionX = 4.25
  dataframe.elementPositionY = 2.75
  dataframe.elementHeight = 7.5
  dataframe.elementWidth  = 7.5

  mpc_image = arcpy.mapping.ListLayoutElements(mxd, 'PICTURE_ELEMENT', 'MPC*')
  mpcimage = mpc_image[0]
  dataframe.elementpositionX = 8.0
  dataframe.elementpositionY = 1.55

  arcpy.mapping.ExportToPDF(mxd, r'P:/Python/' + output + 'topo_tlands.pdf')

  del mxd

