1

I am having some trouble creating a new shapefile and CSV to group wildfires into seasons.

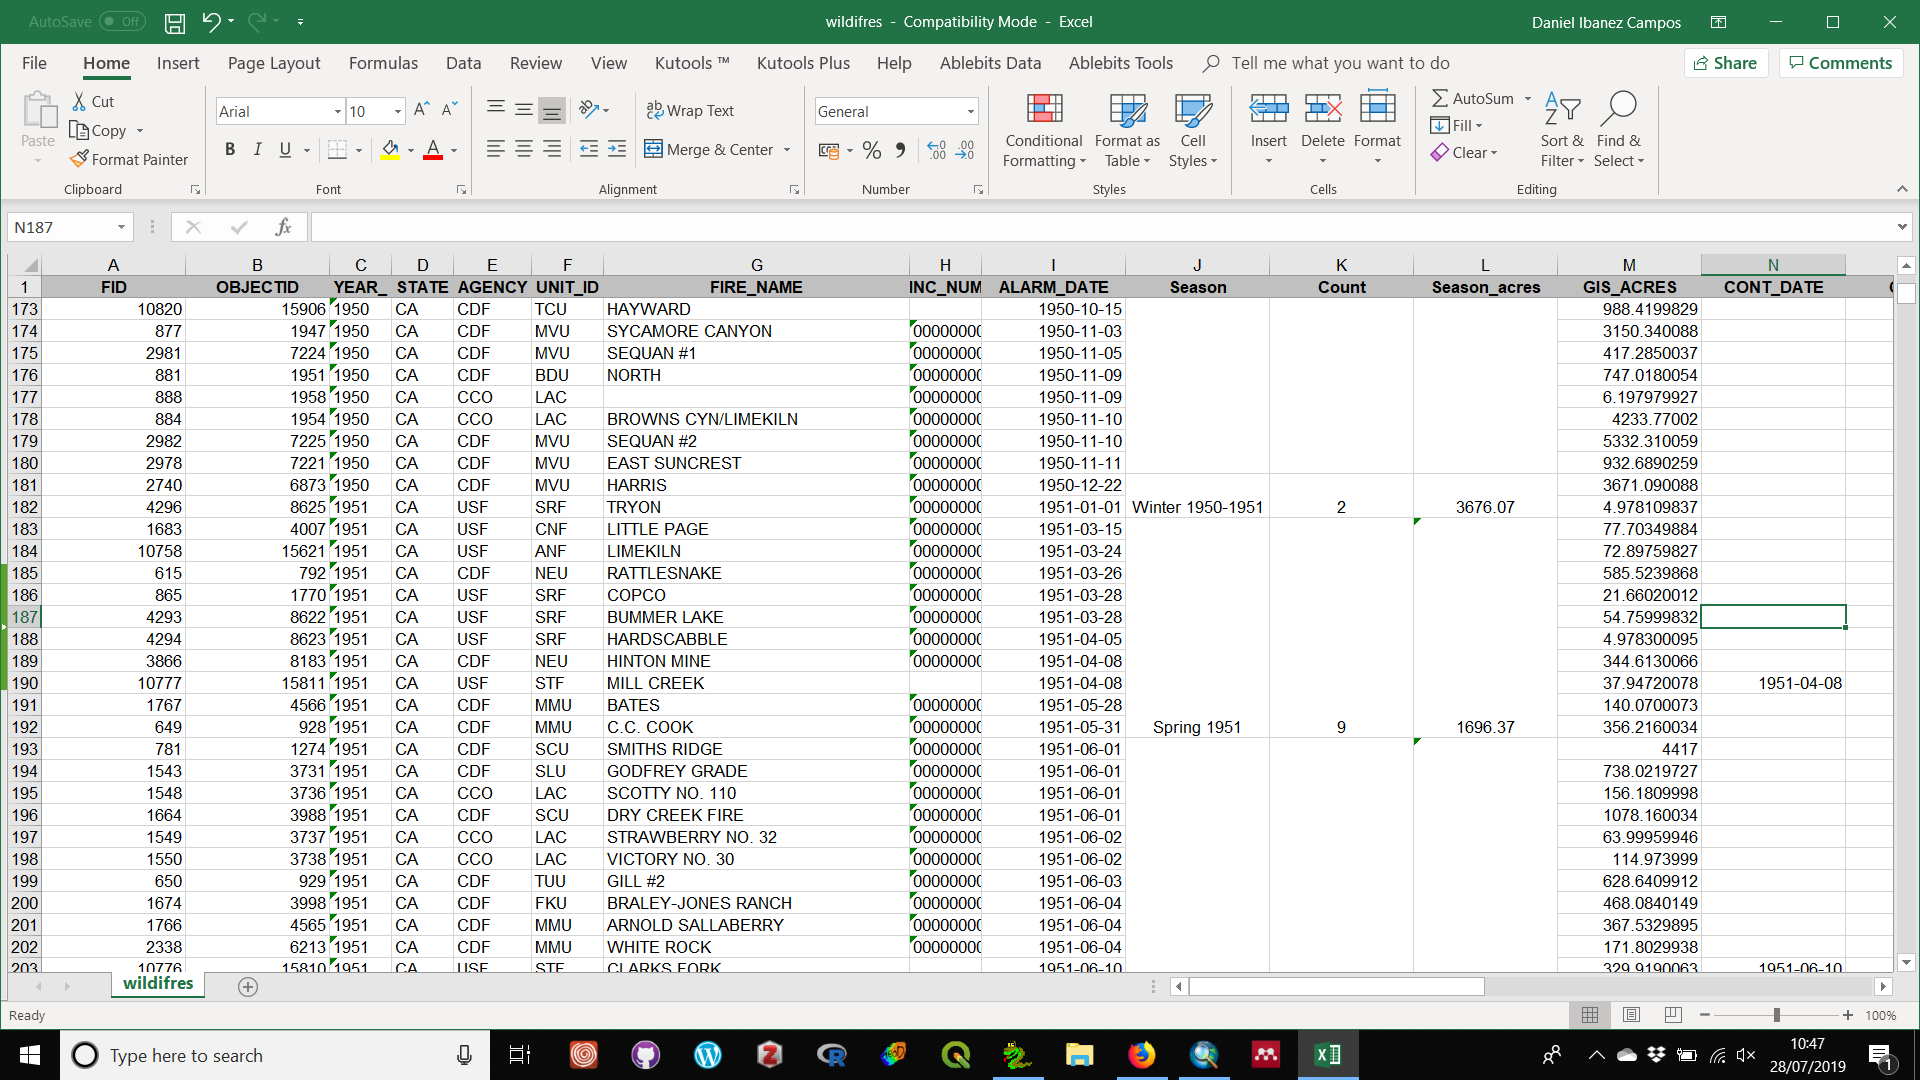
What I want to do is to group the wildfires by meteorological season (summer, fall, winter and spring) for each year. Then, I would like to know how many wildfires and the area burned in each season for each year from 1950 to 2017.

Summer starts from 1st of June to 31st August, fall from 1st September to 30th November, winter from 1st December to 28/29 February and spring from 1st March to 31 May.

The result might be similar to this by creating a new field called "Season", another one called "Count" (to see how many wildfires are in that season) and another column called Season_acres which will be the sum of all acres burned in a season.

enter image description here

So far I have got these two separate scripts:

  1. Using an update cursor
    fc = "fires_1950-2017.shp"
    newfield = "MET_SEAS"
    fieldtype = "TEXT"
    fieldname = arcpy.ValidateFieldName(newfield)
    print "cleaned up fieldname:", fieldname
    arcpy.AddField_management(fc, fieldname, fieldtype, "", "",12)
    print "New field created!"
    delimfield = arcpy.AddFieldDelimiters (fc, "ALARM_DATE")
    cursor = arcpy.da.UpdateCursor(fc, ["MET_SEAS"], """ALARM_DATE >= date '1950-06-01 00:00:00' AND ALARM_DATE <= date '1950-08-31 00:00:00'""")

    for row in cursor:
        row[0] = "Summer 1950"
        cursor.updateRow(row)
    del cursor
  1. Using Statistics analysis, which I am not able to use with an update cursor
    in_table = "fires_1950-2017.shp"
    out_table = r"D:\edited_data\try.csv"
    stat_fields = [["GIS_ACRES", "SUM"], ["GIS_ACRES", "MEAN"]]
    stats = arcpy.Statistics_analysis(in_table, out_table, stat_fields)
    print "script finished"
3

1 Answer 1

1

Use pandas library which is included in ArcGIS >=10.4 python. Create a pandas dataframe using da.SearchCursor. Group by year and quarter (with year ending with february). I had to convert the dates from object (~strings) to datetime and drop na with my test data, these lines are commented below.

import arcpy
import pandas as pd

fc = r"X:\data.gdb\somefc"
date_field = 'DATE123'
area_field = 'AREA'

df = pd.DataFrame.from_records(data=arcpy.da.SearchCursor(fc,[date_field, area_field]), columns=[date_field,area_field])

#df[date_field] = pd.to_datetime(df[date_field])
#df = df.dropna()

df2 = df.groupby([df[date_field].apply(lambda x: x.year), pd.Grouper(key=date_field, freq='Q-FEB')]).agg({date_field:'count',area_field:'sum'}) #https://pandas.pydata.org/pandas-docs/stable/user_guide/timeseries.html#offset-aliases
df2.index.names = ['Year','Season']
df2.columns=['Count','Area']
df2.reset_index(inplace=True)

df2 is now:

    Year     Season  Count           Area
0   2009 2009-02-28     46     267.280001
1   2009 2009-05-31   3147   13808.259995
2   2009 2009-08-31    238    1564.049999
3   2009 2009-11-30   8179   49414.290015
4   2009 2010-02-28    100     468.299997
5   2010 2010-02-28    170     809.760000
6   2010 2010-05-31   7017   27940.599991
7   2010 2010-08-31  89687  434556.820009
8   2010 2010-11-30  41102  190375.410012
9   2010 2011-02-28    715    5007.509982

You can then do df2.to_csv(r'C:\data\out.csv') then add the table to ArcGIS and convert to whatever format you want.

0

Your Answer

By clicking “Post Your Answer”, you agree to our terms of service and acknowledge you have read our privacy policy.

Not the answer you're looking for? Browse other questions tagged or ask your own question.