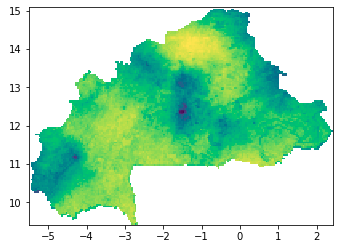
I am fairly new to GIS in general.
I am having some issues converting a GeoTIFF into an numpy array. There are multiple questions online about how to do it, I've tried, many, with the same result each time.
I have a GeoTIFF showing the repartition of a parasite in a country, which, when I open it (with rasterio.open) shows:
Basically what I'd like to do, is turning this heatmap into multiple polygons by different thresholds, which would turn into some sort of topological map. I would get polygons where the concentration of the parasite would be >0.8 for example, then where it is 0.8>concentration>0.5, etc. I thought the best way would be to convert the image into an array, and simply using np.where(), keep parts of the images with pixel values in between 2 thresholds.
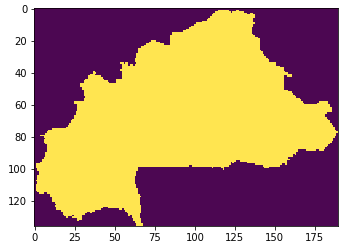
However, when I try to do so, this is what I get:
Numpy turns everything outside of the boundaries of the GeoTIFF into -9999, which I don't mind. However, I lost all the information inside the boundaries, and I don't really know how to keep it. Here is the code used:
data = gdal.Open(PR_files[10])
img = data.GetRasterBand(1)
raster = data.ReadAsArray()
show(raster)
(Note that I have multiple images over the years, with PR_files being the list where I keep all the paths to these images, so I just fetch one as an example. My images only have 1 band by the way).
What I would ultimately like to do, is turn these shapes into a shapely file, and use these Polygons to do some LULC prediction. I have similar images for each year for the past 17 years, and I'd basically try to see if it would be possible to predict the 18th with this method. I have no idea if this would work, but that's why I want to give it a try. This is just a personal project I'm doing to mostly get more familiar with GIS in general.


