1

I'm trying to do patch analyses (similar to those available on Fragstats) on NLCD landscape data (raster data). I have about 2000 points all over the state of NY.

My plan is to:
1) create a 100 meter radii around each point
2) create a new raster layer consisting of these 2000 circles.
-Everything outside the circle is irrelevant and within the circle, is the NLCD landscape data.
-Even if the circles overlap, each circle will be treated as a whole circle and a separate entity from the other circles
3) Use some patch analyses tool afterwards (ie in R, SDMTools)

I have re-projected everything on WGS 1984. Some of the data is private so I've written a code with shell data.

library(raster)
map<-raster(".tif") 
data<-read.csv(".csv")
colnames(data)[1]<-"row_num"
LatLon<-data[,c("LONG","LAT")]

At this point, my relevant files are
1) map - NCLD raster
2) LatLon - coordinates .

#make LatLon into a spatial points class
llCRS<-CRS("+proj=longlat +ellps=WGS84 +datum=WGS84 +no_defs")
LL<-SpatialPoints(LatLon, proj4string = llCRS)

#perform geodesic buffer
library(geobuffer)
library(sf)
buffers_100m <- geobuffer_pts(xy = LL,
                     dist_m = c(100),
                     output = "sf")
#crop map so analyses are faster
map.sub<-crop(map2001,extent(buffers_50m))
#mask to obtain raster within these circles
rr<-mask(map.sub,buffers_100m)
plot(rr)

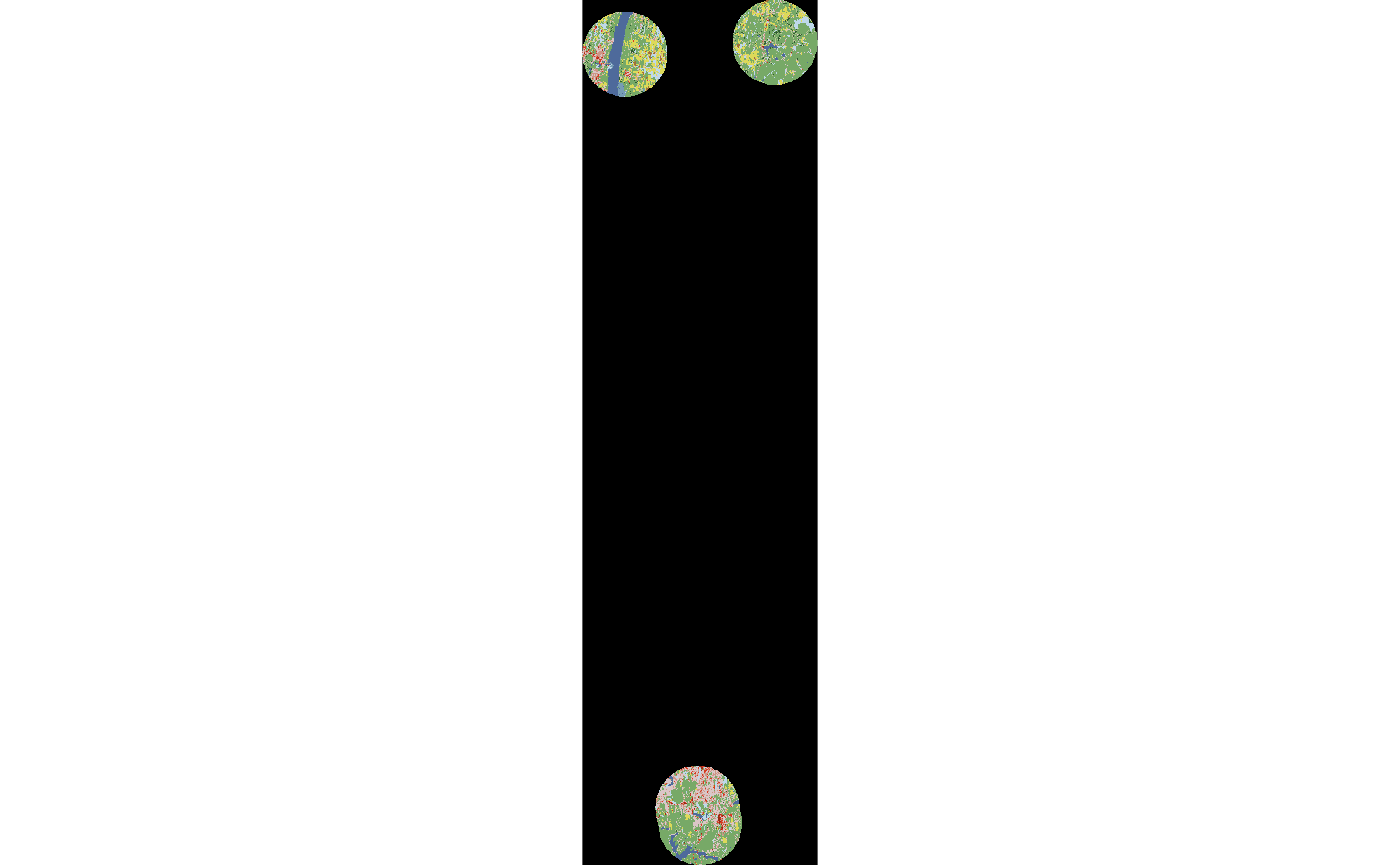
The result rr map that I get is a big black raster. There's no error code and I don't know what this means. enter image description here

I have then tried using less points but making the radius larger so I could see what was happening.

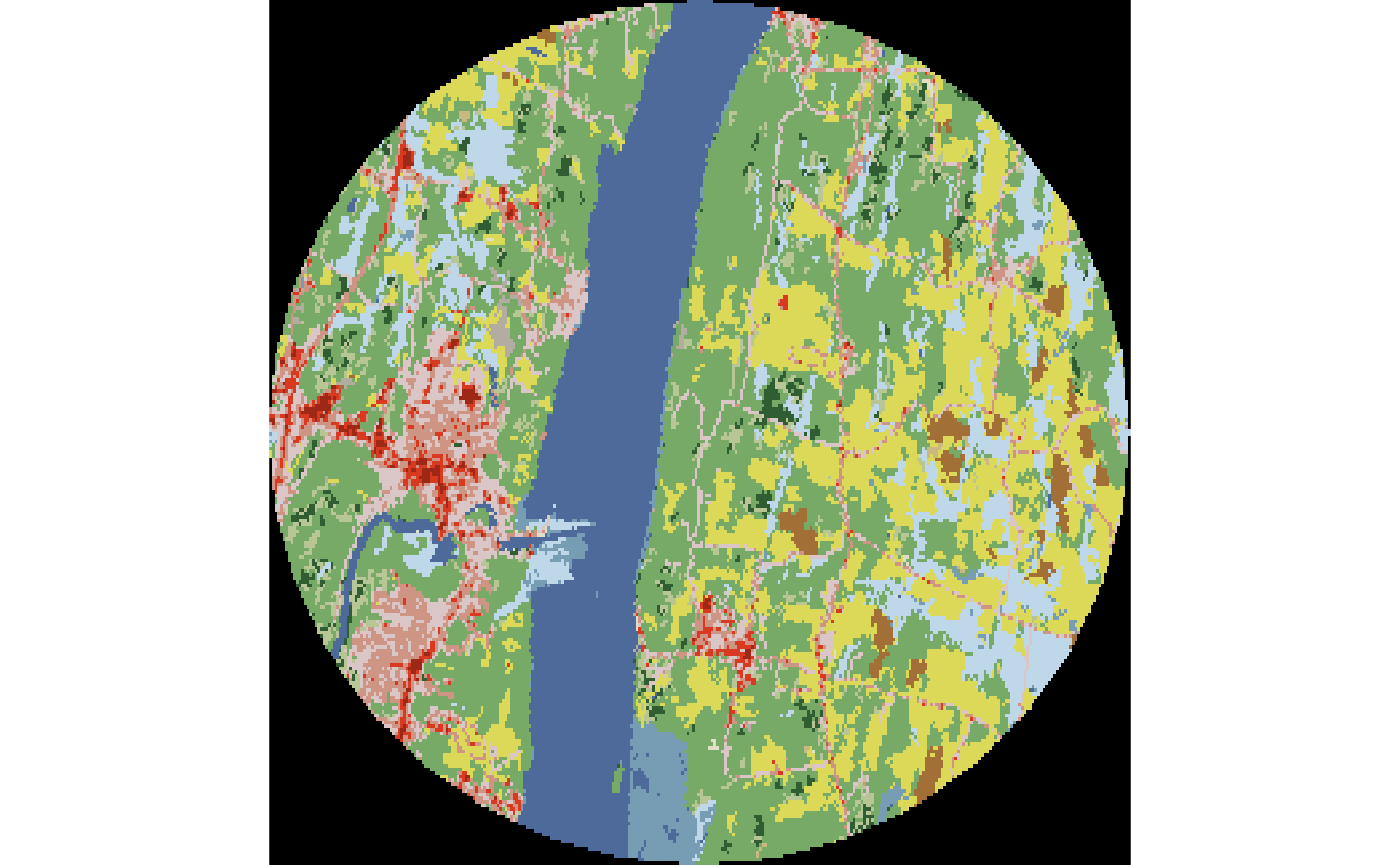
It appears to work with one point:

buffers_test <- geobuffer_pts(xy = LL[1,],
                     dist_m = c(5000),
                     output = "sf")
map.sub<-crop(map2001,extent(buffers_test))
rr<-mask(map.sub,buffers_test)
plot(rr)

enter image description here

Finally, if I try using more points though, the circles are overlapping. I can't tell if each circle is being treated independently.

buffers_test <- geobuffer_pts(xy = LL[1:4,],
                     dist_m = c(5000),
                     output = "sf")
map.sub<-crop(map2001,extent(buffers_test))
 rr<-mask(map.sub,buffers_test)
 plot(rr)

The resulting image is:

enter image description here

Question:
How should I address the overlapping buffer problem?

I expected an image of many circles with black around the irrelevant areas vs a giant black box. rr doesn't look outrageous :

> rr
class       : RasterLayer 
dimensions  : 3226, 1202, 3877652  (nrow, ncol, ncell) 
resolution  : 0.0003753802, 0.0003753802  (x, y)
extent      : -73.9758, -73.5246, 41.20613, 42.41711  (xmin, xmax, ymin, ymax)
coord. ref. : +proj=longlat +datum=WGS84 +no_defs +ellps=WGS84 +towgs84=0,0,0 
data source : in memory
names       : proj2001 
values      : 11, 95  (min, max)

Thoughts
-I wonder at this point whether I should just loop through each of the 2000 point (replicating the 2nd image 2000x) before performing my landscape statistics on each image individually. I don't have any great ideas and feel like I've exhausted my options.

-I've seen some similar codes online but it's not with raster data or only working with a few points.

Things that I've tried

I've posted all the steps that I've tried below because I'm not confident that this is the best method. If there is an easier method that I haven't yet tried, please let me know.

Fragstats: Error will say it aborted but doesn't give a reason why. Aside from help manual and tutorial, most websites/youtube are in French.

ArcGIS -I've tried zonal statistics, clip, mask, converting raster to polygon, etc. For some reason, it will show that the task is complete but the output (ie the new layer) will never appear.

Converting raster to a shapefile: - it crashes in R (ie it keeps running forever but when I check the server usage, the CPU appears as if it's not working) and ArcGIS only produces a corner of the original raster image extent. It seems shapefiles are easier to work with and there are more tools available for doing the patch type analyses that I want.

1
  • 1
    Welcome to GIS SE. As a new user, please take the Tour, which emphasizes the importance of asking One question per Question. Please Edit your question focus it on a single issue.
    – Vince
    Commented Jul 29, 2019 at 16:07

1 Answer 1

3

You are reinventing the wheel here. There is a function land.metrics in the spatialEco package that calculates point (radius) and polygon landscape metrics. The focal.lmetrics function facilitates moving window metrics. You could also take a look at the sample_lsm function in the landscapemetrics package. It is written in Rcpp so, is quite fast and efficient but, if not familiar with tidyverse, can be tricky to digest results.

library(raster)
library(landscapemetrics)    
library(sp)

 r <- raster(nrows=180, ncols=360, xmn=571823.6, xmx=616763.6, ymn=4423540, 
             ymx=4453690, resolution=270, crs = CRS("+proj=utm +zone=12 +datum=NAD83 
             +units=m +no_defs +ellps=GRS80 +towgs84=0,0,0"))

 r[] <- rpois(ncell(r), lambda=1)
 r <- calc(r, fun=function(x) { x[x >= 1] <- 1; return(x) } )  
 x <- sampleRandom(r, 10, na.rm = TRUE, sp = TRUE)
   x$ID <- 1:nrow(x)

#### spatialEco package
lmet <- c("prop.landscape", "edge.density", "prop.like.adjacencies", "aggregation.index") 
( class.1 <- land.metrics(x=x, y=r, bw=1000, bkgd = 0, metrics = lmet) )
  ( all.class <- land.metrics(x=x, y=r, bw=1000, bkgd = NA, metrics = lmet ) )
    all.class[["0"]]

#### landscapemetrics package (returns all landscape level metrics)

( plm <- sample_lsm(r, y = coordinates(x), shape = "circle", plot_id = x$ID, 
           size = 1000, level= "landscape") )

The new version of spatialEco 1.2-0 is taking quite some time to propagate the windows build to all the mirrors but, you can use the main CRAN server with: install.packages("spatialEco", repos="cloud.r-project.org") or install the development version from github. remotes::install_github("jeffreyevans/spatialEco")

The landscapemetrics package is also available on CRAN with the development version available with: devtools::install_github("r-spatialecology/landscapemetrics") and devtools::install_github("r-spatialecology/landscapetools")

In regard to the Fragstats software, McGarigal has (absolutely) retired and there is nobody that has stepped up to maintain the software. The latest release was 4.2 and it is having issues with Windows 10 and GDAL. Some errors seem be associated with calls to an old version of GDAL and are not reconcilable without addressing it at the source code level and recompiling the software.

4
  • spatialEco seems to do exactly what I want. Looking at the manual though, it's unclear to me whether it's a planar vs geodesic buffering. Could you shed some light on that? I really appreciate you providing both options that seems FAR easier and for giving me an update on Fragstats! To also follow up (if you happen to know), it sounds like I shouldn't use SDMtools too (which is based on FragStats) then? Thanks!
    – Tammy
    Commented Jul 29, 2019 at 17:24
  • I would highly recommend transforming your data into a distance based projection. The NLCD data is in the USGS Albers projection to begin with and is well supported for CONUS analysis. You can use latlong = TRUE to account for geodesic data but, I do not recommend it as the nature of some metrics are distance/proximity based and geographic projections this can introduce some unintended or unforeseen errors in code implementations of metrics. Just use sp::spTransform for the points and raster::projectRaster with the method="ngb" for nominal data. Commented Jul 29, 2019 at 17:48
  • 1
    Honestly, I would recommend using the landscapemetrics package as it is faster and very well thought out with the specific intent being a replacement for Fragstats. Commented Jul 29, 2019 at 17:50
  • Thank you for responding and advice. So, just to confirm that I understood your advice with my working knowledge of spatial data analysis and based on what I looked up, I should transform the lat long coordinate points (which is in WGS 1984) into Albers Conus? By doing this method, I can just pick any meters radii (because Albers Conus is in meters). Is this correct? Albers is an equal area conic -- this the same as distance based projection/CONUS analysis?
    – Tammy
    Commented Jul 29, 2019 at 18:28

Not the answer you're looking for? Browse other questions tagged or ask your own question.