3

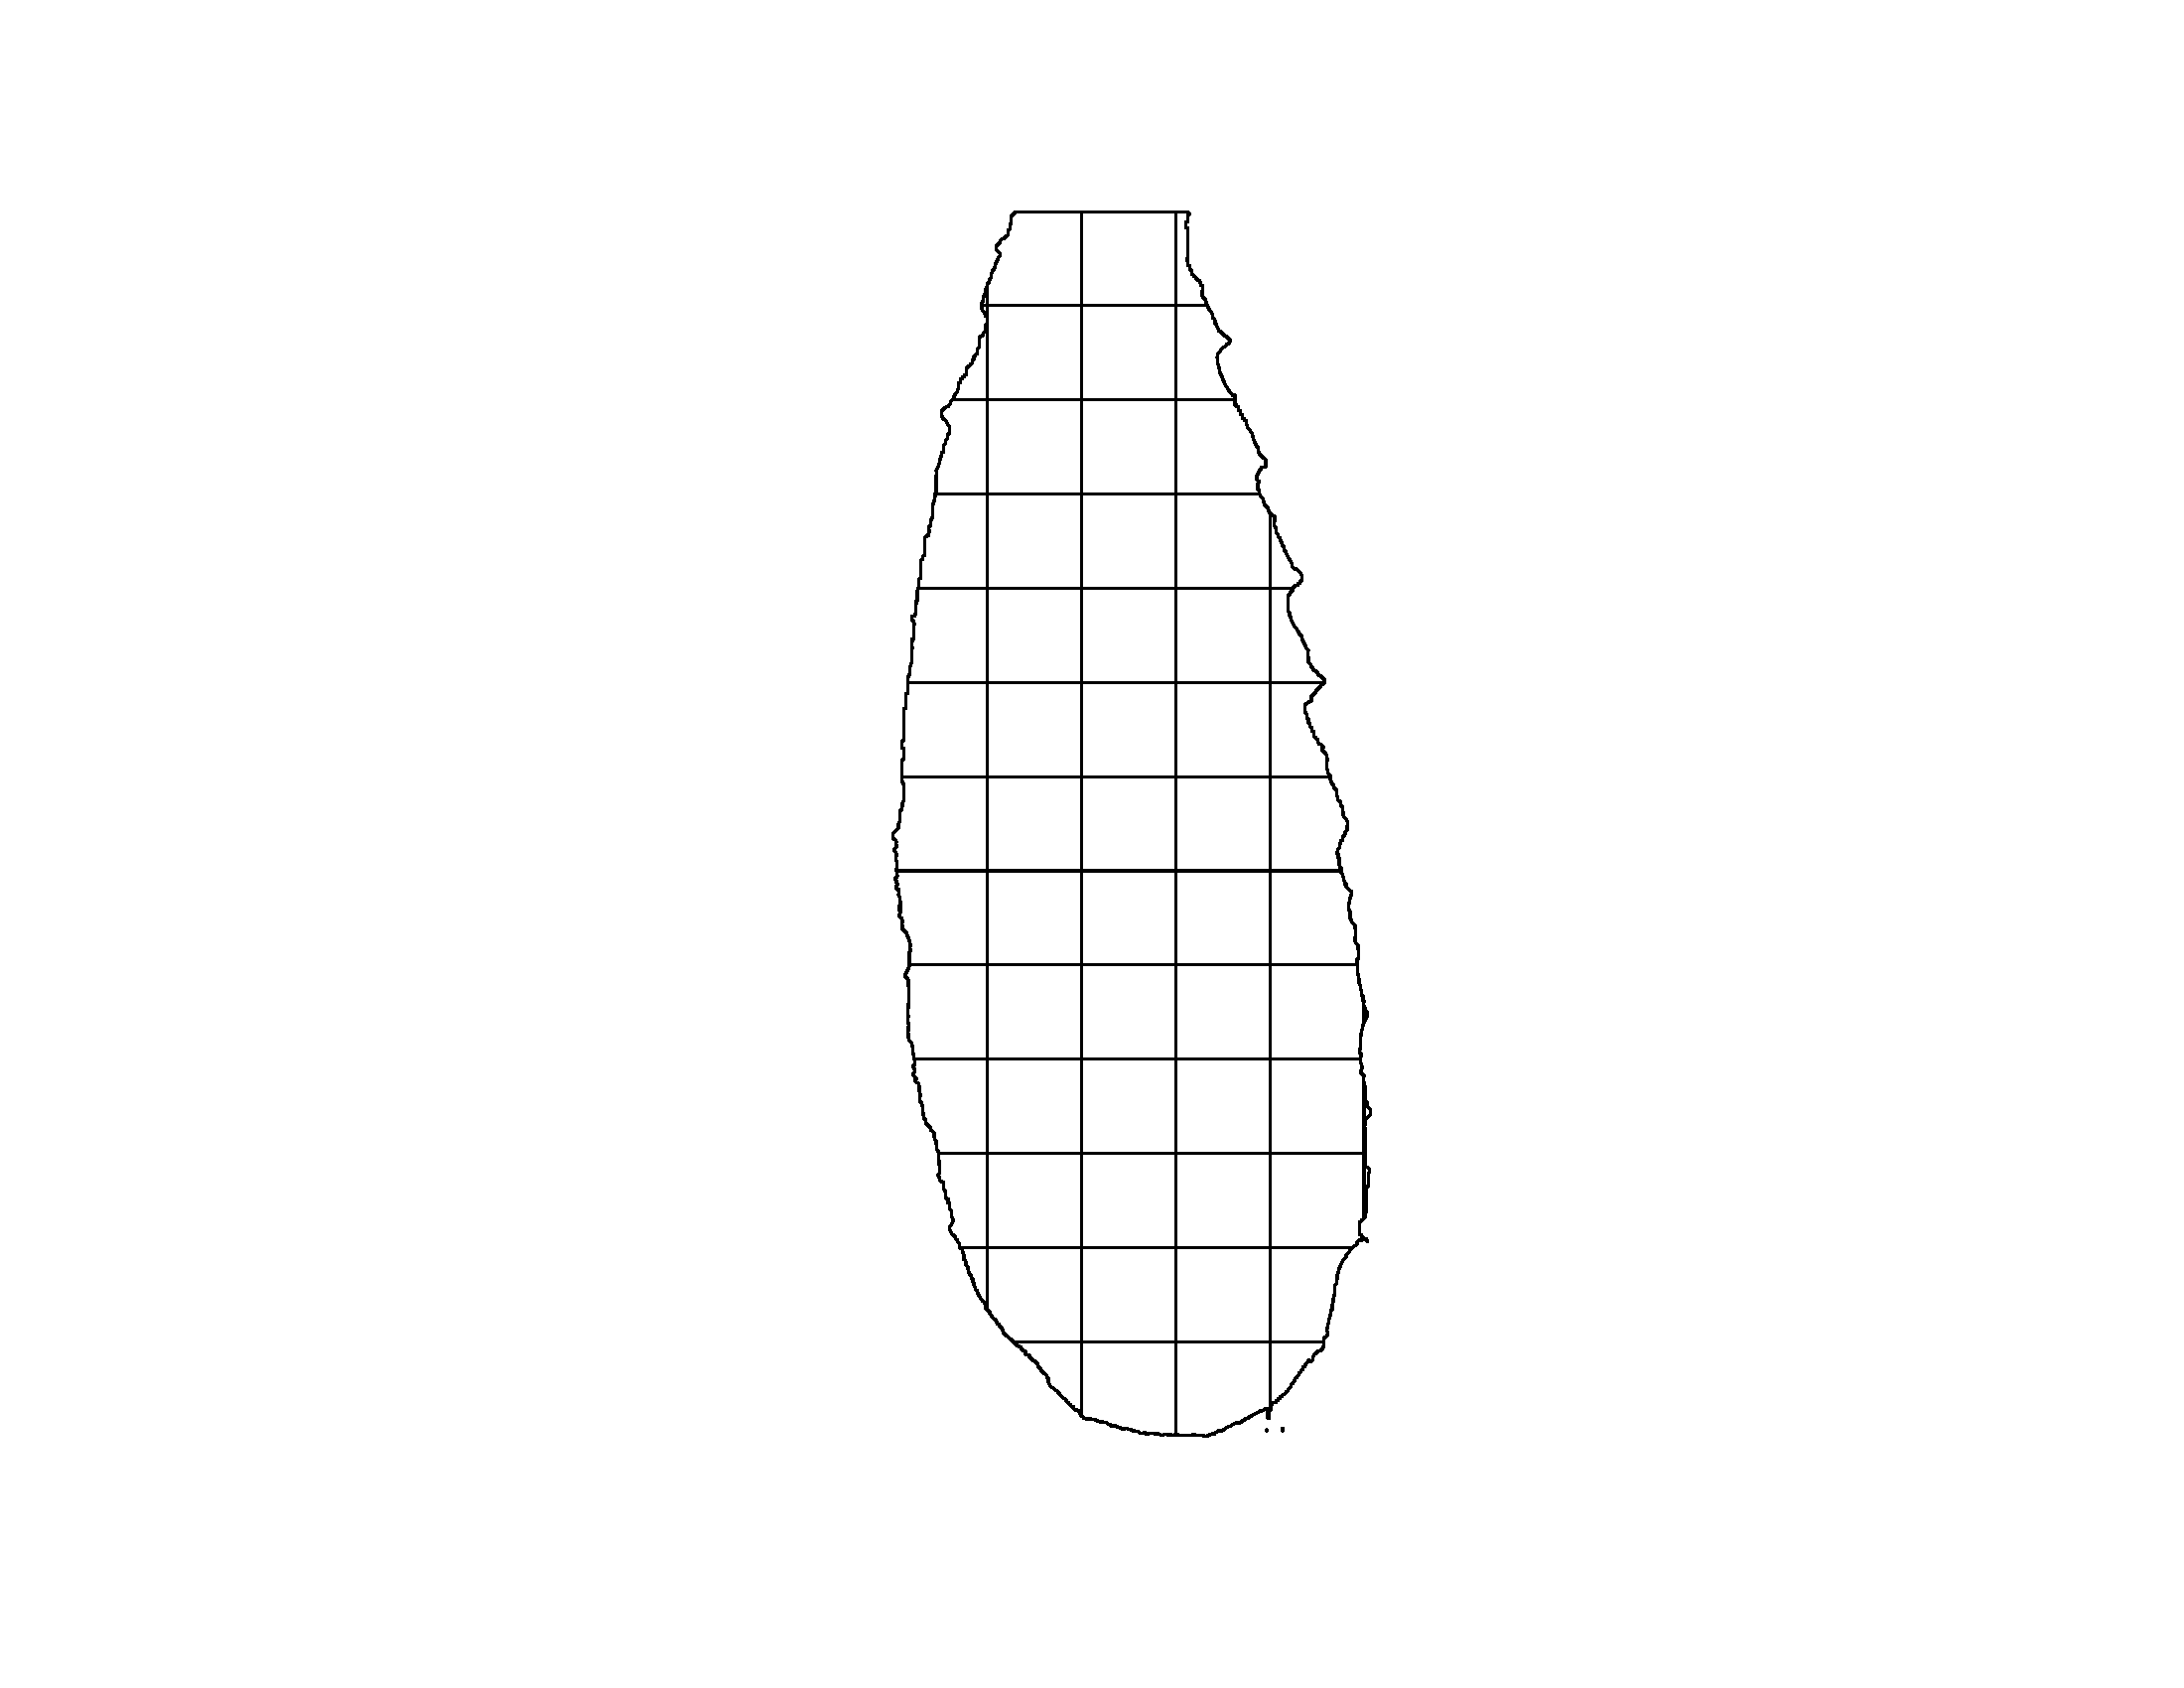
I am trying to take a polygon and add grid lines over top, then divide the polygon into many polygons based on the grids. I've accomplished this through st_make_grid() and raster::intersect().

The outcome is correct:

enter image description here

But I would like to later reference each cell (now individual polygons in a SpatialPolygonsDataFrame) with alphanumeric labels, in which the letter references the row the cell is in and the number references the column the cell is in. I can't find any way to do this via st_make_grid() or anything else.

library(spatialEco)
library(raster)
library(dplyr)
library(sp)
library(maptools)
library(sf)
library(rgdal)
library(rgeos)

#owin2Polygons is just for conversion
owin2Polygons <- function(x, id="1") {
  stopifnot(is.owin(x))
  x <- as.polygonal(x)
  closering <- function(df) { df[c(seq(nrow(df)), 1), ] }
  pieces <- lapply(x$bdry,
                   function(p) {
                     Polygon(coords=closering(cbind(p$x,p$y)),
                             hole=is.hole.xypolygon(p))  })
  z <- Polygons(pieces, id)
  return(z)
}

tess2SP <- function(x) {
  stopifnot(is.tess(x))
  y <- tiles(x)
  nam <- names(y)
  z <- list()
  for(i in seq(y))
    z[[i]] <- owin2Polygons(y[[i]], nam[i])
  return(SpatialPolygons(z))
}

owin2SP <- function(x) {
  stopifnot(is.owin(x))
  y <- owin2Polygons(x)
  z <- SpatialPolygons(list(y))
  return(z)
}
w3 <- owin(xrange=c(55,562), yrange=c(137,1436)) #dummy window

spatpoly3 <- owin2SP(w3)


grid<-st_make_grid(spatpoly3, cellsize = 100, square = TRUE) 
grid
gr_t2 <- as_Spatial(grid, cast = TRUE, IDs = paste0("ID", 1:length(grid)))
gr_t2 <- gBuffer(gr_t2, byid=TRUE, width=0)
spatpoly3 <- gBuffer(spatpoly3, byid=TRUE, width=0)
newLines <- raster::intersect(gr_t2, spatpoly3)
plot(newLines)
getSpatialPolygonsLabelPoints(newLines)
class(newLines)

numb3 <- data.frame(number = 1:length(newLines))
( pid <- sapply(slot(newLines, "polygons"), function(x) slot(x, "ID")) )
( p.df <- data.frame( ID=1:length(newLines), row.names = pid) )

polygrid_numbered3 <- SpatialPolygonsDataFrame(newLines, p.df)

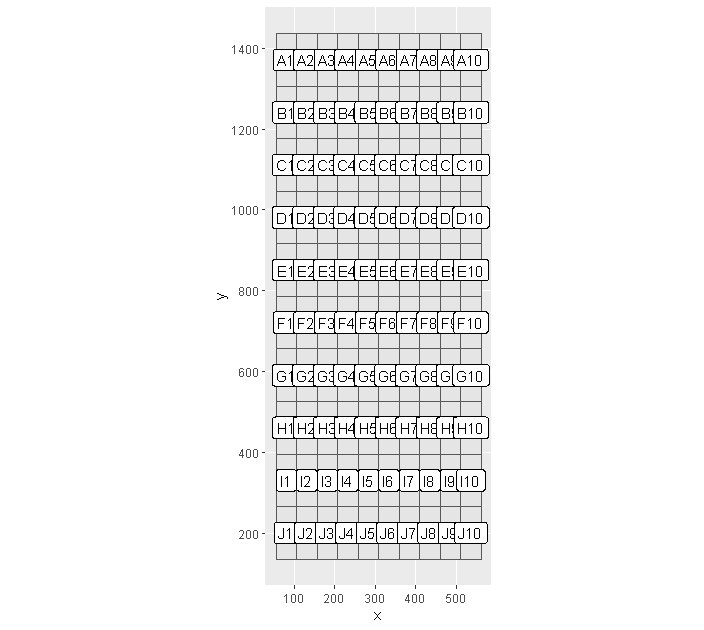
With help from @obrl_soil I'm very close, but for some reason, setting cell size in st_make_grid throws the labeling off: enter image description here
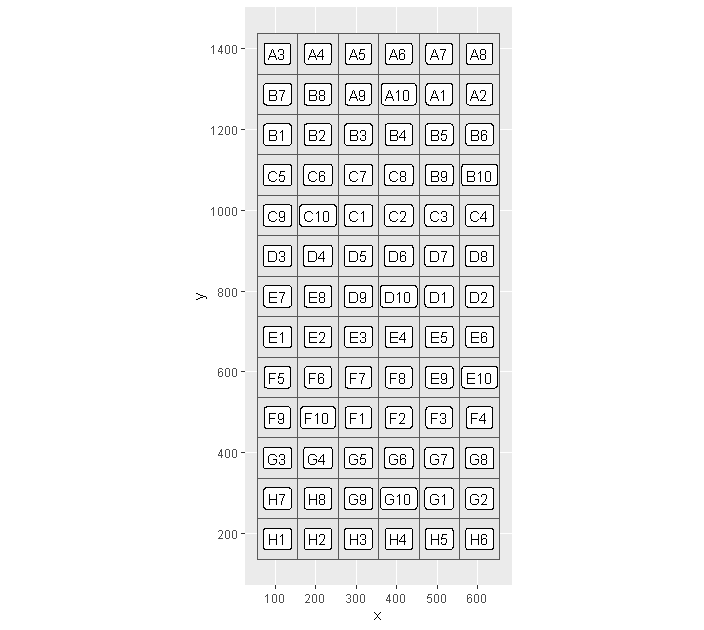
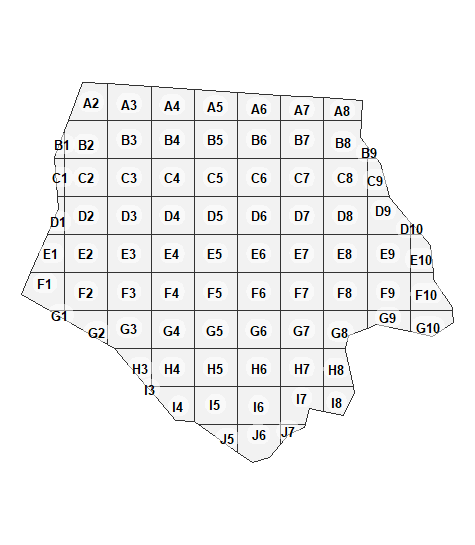
If I remove cellsize but leave "square = TRUE", the labeling is correct but the cells are not squares:

enter image description here

Any ideas?

4
  • 1
    I can see a way to probably do this but I can't follow your workflow and run your code without w3, and you should probably also show which packages you are using (looks like a mix of sf, sp, rgeos and wherever owin2SP comes from (spatstat?).
    – Spacedman
    Commented Sep 10, 2019 at 19:30
  • @Spacedman Apologies for leaving out the packages and w3: I've edited the original post to include a dummy window with the same dimensions as my window. I also included the function that converts owin to SP. Commented Sep 10, 2019 at 20:08
  • Have also added spatstat and now getting: Error in is.hole.xypolygon(p) : could not find function "is.hole.xypolygon"
    – Spacedman
    Commented Sep 10, 2019 at 21:39
  • Sorry, it must be in spatstat.utils. I thought that was installed alongside spatstat. library(spatstat.utils) Commented Sep 11, 2019 at 1:28

2 Answers 2

3

This should do what you need:

library(raster)
library(sf)
library(fasterize)

nc <- sf::st_read(system.file("shape/nc.shp", package="sf"))
nc1 <- nc[1, ]

# make grid (just using default 10x10 here)
ng1 <- sf::st_make_grid(nc1) 
ng1 <- sf::st_sf(ng1, 'ID' = seq(length(ng1)), ng1)

# rasterise grid (ID becomes cell value)
nr1 <- raster::raster(ng1) # method from fasterize pkg

# get X and Y from row and col numbers, convert Y to letters
ng1$X <- raster::colFromCell(nr1, ng1$ID) # or seq(ncell(nr1))
ng1$Y <- rev(LETTERS[raster::rowFromCell(nr1, ng1$ID)])

# combine for label
ng1$LAB <- paste0(ng1$Y, ng1$X)

# trim back to polygon
ng1 <- sf::st_intersection(ng1, st_geometry(nc1))

enter image description here

Might be trickier if the grid has to be relative to a larger space.

EDIT: it is! Ok, there are two issues: first you can't seem to use cellsize - instead, calculate the number of rows and columns you need to hit your desired cellsize, and then specify them in both the grid and the raster conversion. Second, to handle cases where row number exceeds 26, you need a function. This one is good enough:

# converted from https://www.geeksforgeeks.org/find-excel-column-name-given-number/
excel_col <- function(n = NULL) {
  if(n < 1) { stop("Please provide a positive number")}
  if(n <= 26) { return(LETTERS[n]) }
  out = c()
  while(n > 0) {
    rem <- n %% 26
    if(rem == 0) {
    out <-  append(out, 'Z')
    n <- (n/26) - 1
    } else {
      out <- append(out, LETTERS[rem])
      n <- n/26
    }
  }
  paste0(rev(out), collapse = '')
}

then, e.g. for a large grid:

# let's make a grid across the whole state instead and then subset
ng1 <- sf::st_make_grid(nc, n = c(100, 30)) 
ng1 <- sf::st_sf(ng1, 'ID' = seq(length(ng1)), ng1)

# have to specify matching row/col 
nr1 <- fasterize::raster(ng1, ncol = 100, nrow = 30) 
nr1[] <- ng1$ID

ng1$X <- raster::colFromCell(nr1, ng1$ID) # or seq(ncell(nr1))
# better letters:
ng1$Y <- rev(sapply(raster::rowFromCell(nr1, ng1$ID), excel_col))

ng1$LAB <- paste0(ng1$Y, ng1$X)

# trim back to polygon of choice
test <- sf::st_intersection(ng1, st_geometry(nc[100, ]))

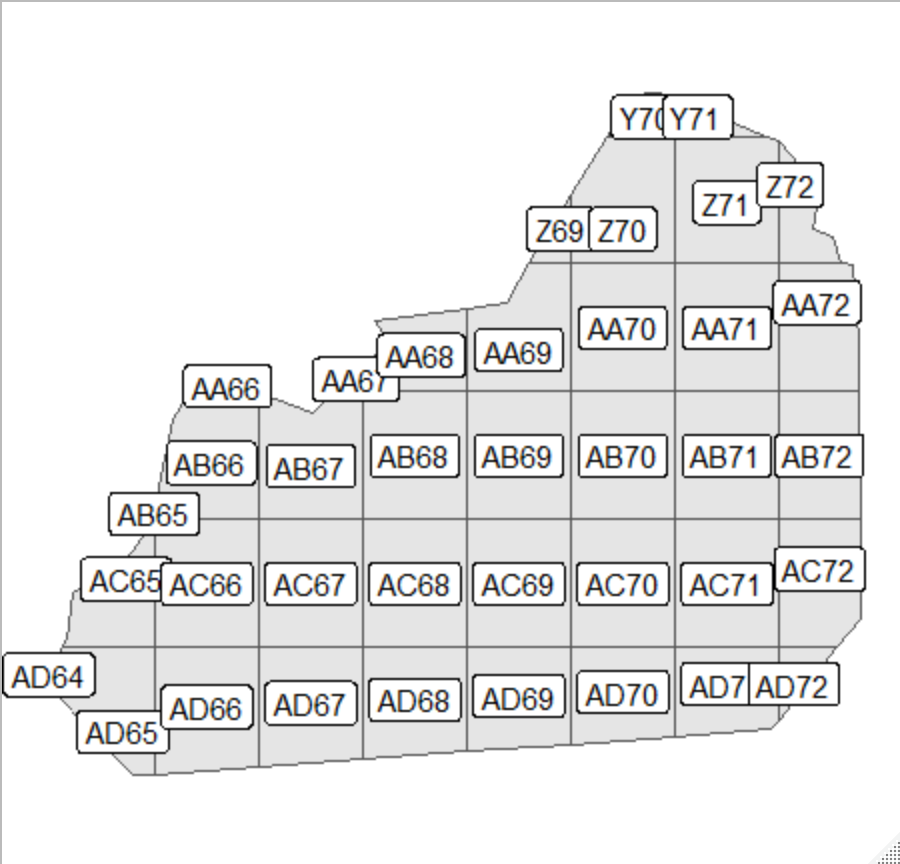
enter image description here

5
  • Thank you! I've got it very close, but something strange is happening with st_make_grid and st_sf. If I try to set the cell size with st_make_grid, the labeling is off. Any ideas? I would like to have a set square cell size. Commented Sep 11, 2019 at 16:17
  • I've edited the original post to show the outcomes of st_make_grid and the improper labeling. Commented Sep 11, 2019 at 16:24
  • 1
    Yeah I was playing with this last night (100x30 grid) and I think the problem is related to the alphanumeric rows, but haven't had time to solve yet.
    – obrl_soil
    Commented Sep 12, 2019 at 1:26
  • 1
    ok, think i cracked it @JamesFischer, see if that helps
    – obrl_soil
    Commented Sep 12, 2019 at 11:19
  • thank you so much for the help! With a few very small tweaks it works perfectly with what I want to do! Commented Sep 12, 2019 at 16:00
2

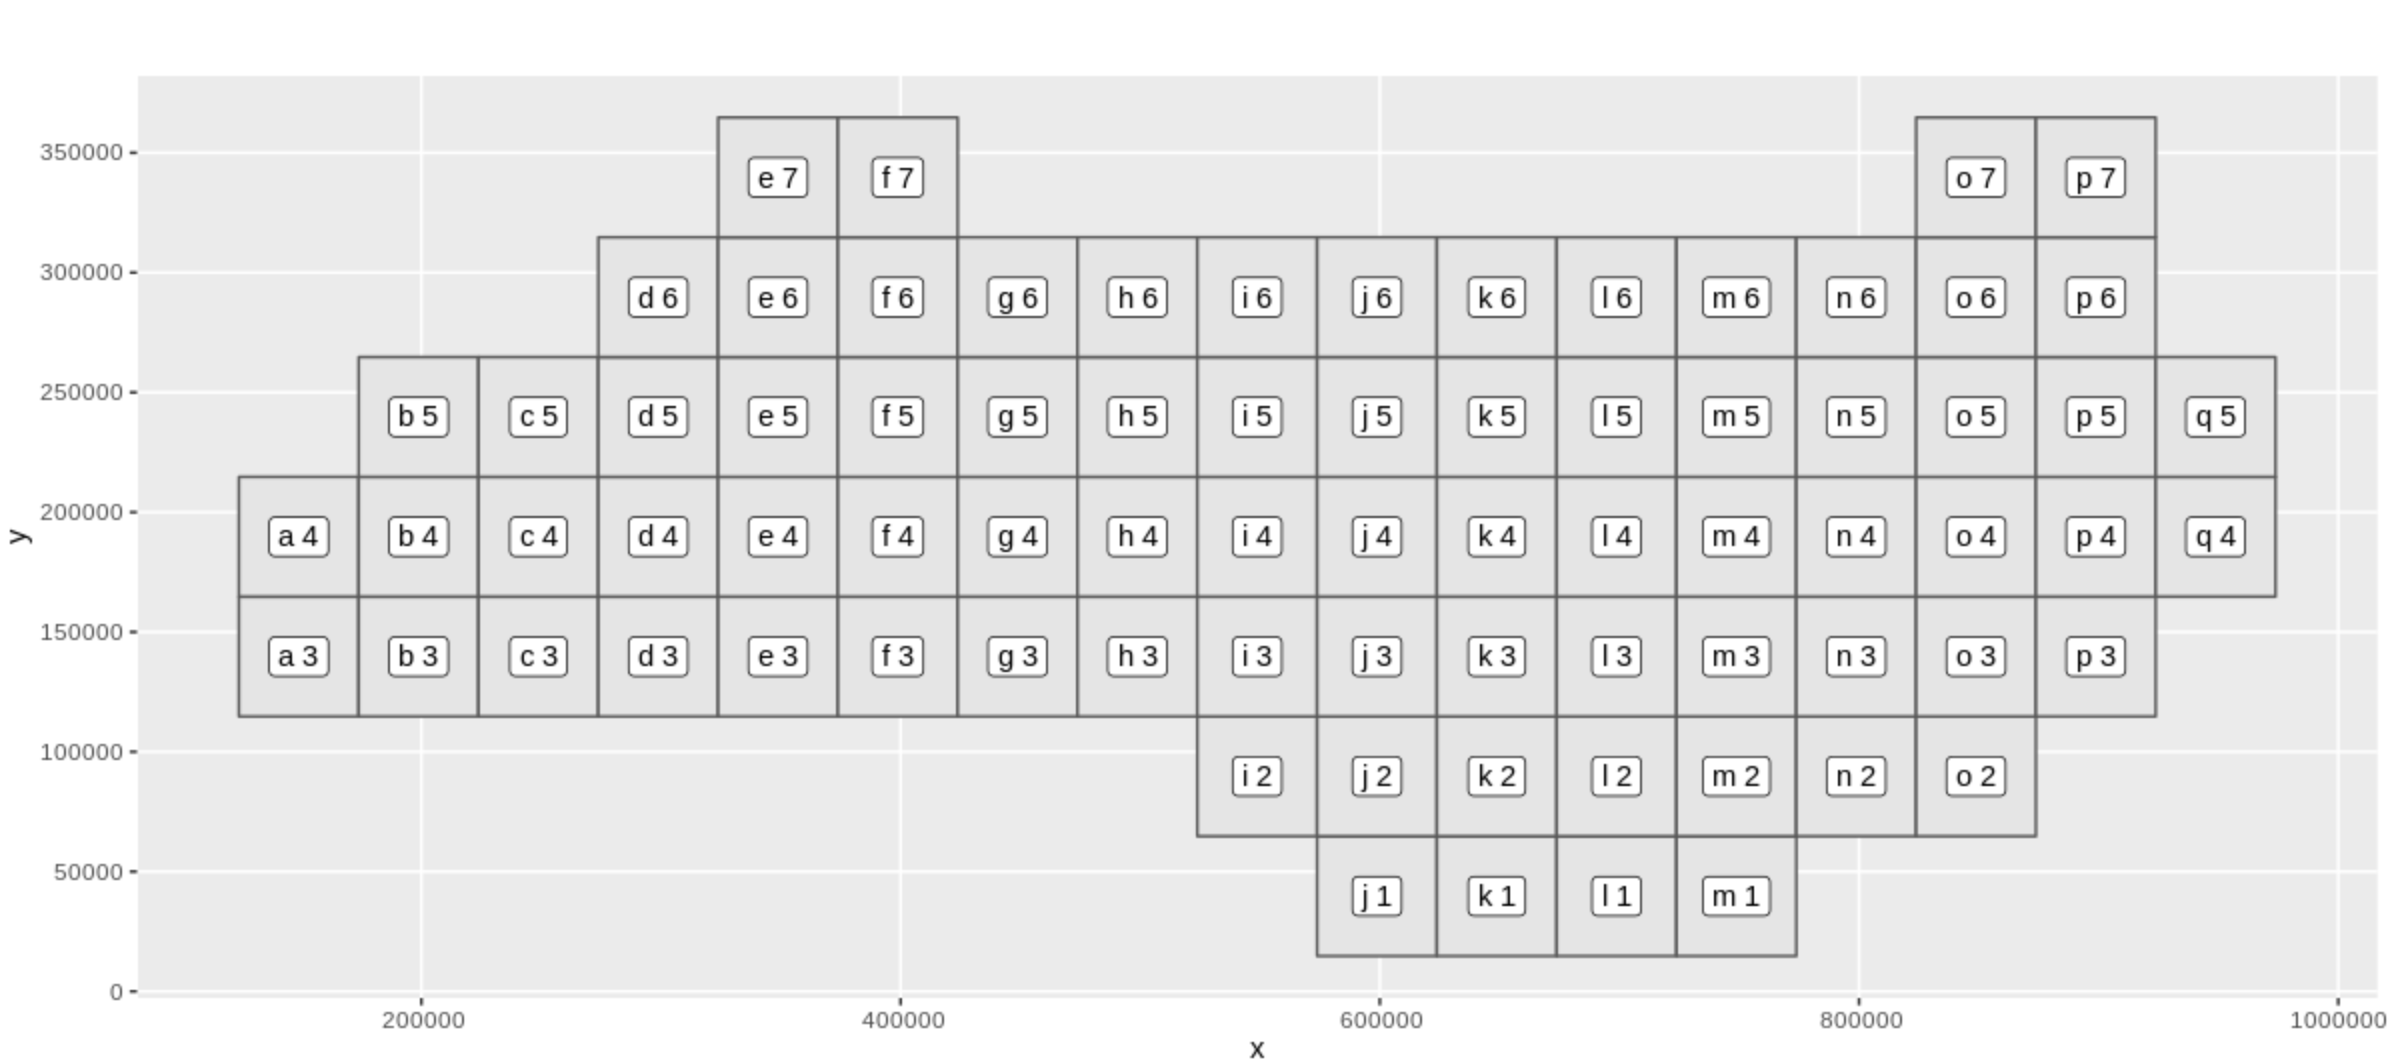
I couldn't get the above method to work so have developed a different version. Hopefully helpful to someone in the near future.

require(sf)
require(dplyr)
require(ggplot2)

# pick a grid cell size
ovrGridSize <- 50000

# import data and reproject
pol <- sf::st_read(system.file("shape/nc.shp", package="sf")) %>% 
  st_transform(32119)

# make grid and number cells
reqGrid <- st_make_grid(pol, cellsize = ovrGridSize) %>% st_sf %>% 
  dplyr::mutate(id = 1:nrow(.))

# make bounding box
reqGridBbox <- st_bbox(reqGrid)

# calculate number of rows/columns
nCols <- (reqGridBbox[3]-reqGridBbox[1])/ovrGridSize
nRows <- (reqGridBbox[4]-reqGridBbox[2])/ovrGridSize

# label by row / column number and combine labels
reqGrid.l <- reqGrid %>% 
  mutate(cols = rep(letters[1:nCols],nRows),
         rows = unlist(lapply(1:nRows, rep, nCols))) %>% 
  group_by(id) %>% 
  mutate(lab = paste(cols,rows,collapse='')) %>% 
  dplyr::filter(id %in% unlist(st_intersects(pol,.))) # filter by intersection

# plot
ggplot(reqGrid.l) + 
  geom_sf(data=reqGrid.l) + 
  geom_label(data=reqGrid.l,
             aes(label = lab, geometry = geometry),
             stat = "sf_coordinates") +
  coord_sf(datum=st_crs(32119))

plot of grid

Your Answer

By clicking “Post Your Answer”, you agree to our terms of service and acknowledge you have read our privacy policy.

Not the answer you're looking for? Browse other questions tagged or ask your own question.