1

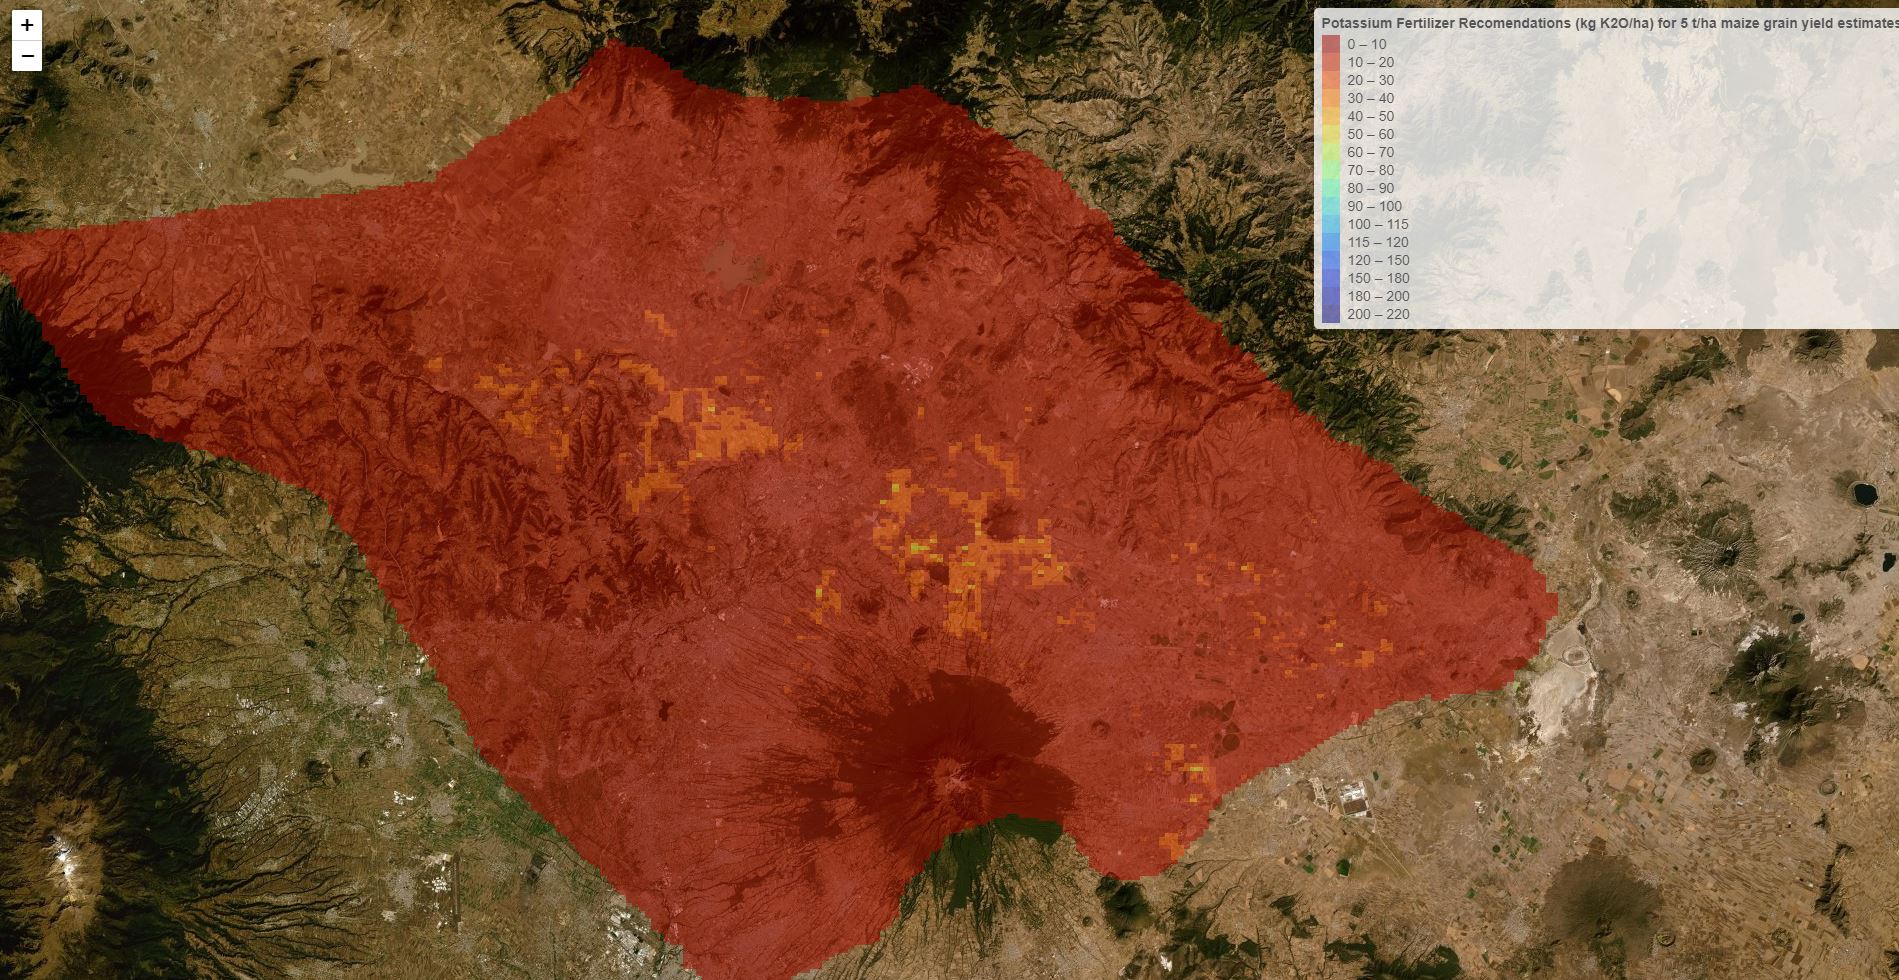
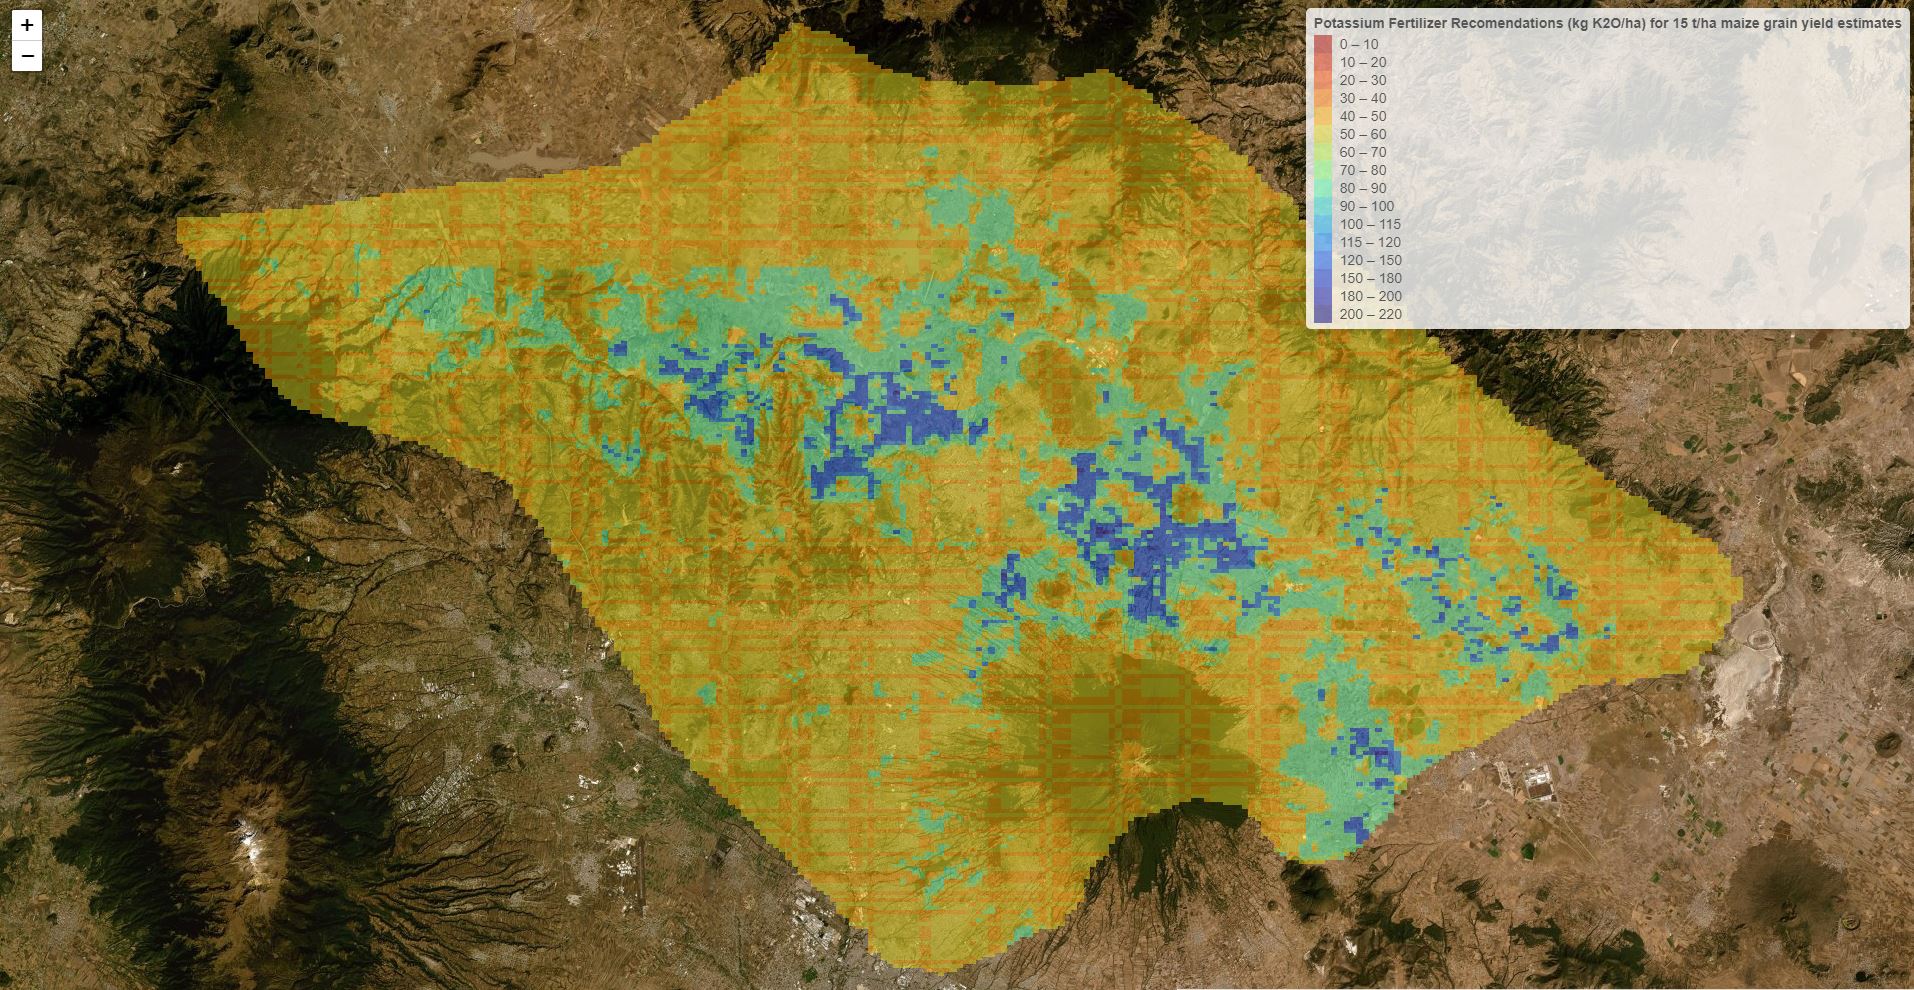
I have been creating leaflet maps from raster files with discrete values. Leaflet creates smooth maps form some of the rasters, but in other there is a strange pattern of geometric striations across the map. All of the rasters were derived from one original raster. In addition, the source raster files used to create the leaflet maps do not have this strange pattern.

Below is the code:

This code chunk creates the 'expected' maps

f <- function(r) {
  ifelse(r <= 100, 50,
         ifelse(r >= 100 & r < 150, 20,
                    ifelse(r >= 150, 0, NA)))
}

r1 <- calc(r, fun = f)

writeRaster(r1, overwrite=TRUE, 'filePath/r1.tif')

r1 <- projectRasterForLeaflet(r1, method = 'ngb')

pal_r1 <- colorBin(SAGA_pal[[1]], values(r1), bins = c(0,10,20,30,40,50,60,70,80,90,100,115,120,150,180,200,220), na.color = "transparent", reverse=TRUE)

(ll_r1 <- leaflet() %>% 
    addProviderTiles("Esri.WorldImagery") %>%
    addRasterImage(r1, colors=pal_r1, opacity=0.5) %>%
    addLegend(pal=pal_r1, values=values(r1), title="r1")
)

link to r1 image

This code chunk creates the strange pattern:
f <- function(r) {
  ifelse(r <= 100,180,
         ifelse(r >= 100 & r < 150, 120,
                ifelse(r >= 150 & r < 200, 80,
                       ifelse(r >= 200 & r < 400, 50,
                              ifelse(r >= 400 & r < 800, 50,
                                     ifelse(r >= 800 & r < 1200, 30,
                                            ifelse(r >= 1200,0, NA)))))))
}

[![r1][1]][1]

r2 <- calc(r, fun = f)

writeRaster(r2, overwrite=TRUE, 'filePath/r2.tif')

r2data <- r2

r2data <- projectRasterForLeaflet(r2data, method = 'ngb')

pal_r2 <- colorBin(SAGA_pal[[1]], values(r2data), bins = c(0,10,20,30,40,50,60,70,80,90,100,115,120,150,180,200,220), na.color = "transparent", reverse=TRUE)

(ll_r2 <- leaflet() %>% 
    addProviderTiles("Esri.WorldImagery") %>%
    addRasterImage(r2data, colors=pal_r2, opacity=0.5) %>%
    addLegend(pal=pal_r2, values=values(r2data), title="R2")
)

r1

r2

3
  • 1
    I'm struggling to see any strange patterns in this image, possibly because its quite low resolution. Can you re-upload a higher-resolution image?
    – Spacedman
    Commented Nov 6, 2019 at 15:09
  • Sorry, there is 2MB file size limit. I'll add the HTML files
    – dtg37
    Commented Nov 6, 2019 at 16:15
  • Could not add the htlms, but changed the images for jpgs with increased resolution
    – dtg37
    Commented Nov 6, 2019 at 16:24

1 Answer 1

1

The error causing this problem was in the classification of the leaflet palette. In the original code color mapping was done using the colorBin function:

pal_r2 <- colorBin(SAGA_pal[[1]], values(r2data), bins = c(0,10,20,30,40,50,60,70,80,90,100,115,120,150,180,200,220), na.color = "transparent", reverse=TRUE)

colorBin is intended to be used on continuous numeric data. The data I was using discrete numeric data. I believe that as the data was discrete, leaflet was not able to process this data through continuous processes. This resulted in the patter that I saw. I changed the function to colorFunction (intended to be used for discrete data).

pal <- colorFactor(SAGA_pal[[1]], domain = c(0,10,20,30,40,50,60,70,80,90,100,115,120,150,180,200,220), ordered = FALSE,
                   na.color = "transparent", alpha = FALSE, reverse = TRUE)

This fixed the problem.

Your Answer

By clicking “Post Your Answer”, you agree to our terms of service and acknowledge you have read our privacy policy.

Not the answer you're looking for? Browse other questions tagged or ask your own question.