2

I have data that maps lat lon of a storm for every day as follows (I have removed the day ID so it has only year and month)

lat_lonDat <- structure(list(Latitude = c(9.1, 9.15755, 9.2, 9.21496, 9.06, 
              8.89169, 8.84286, 9.04619, 9.3, 9.31138, 9.3, 9.45992, 9.65, 
              9.76127, 9.85, 9.94991, 10.05, 10.1651, 10.25, 10.2725, 10.25, 
              10.1887, 10.15, 10.21, 10.3, 10.3163, 10.4, 10.6962, 11, 11.0975, 
              11.15, 11.2587, 11.45, 11.755, 12.15, 12.615, 13.05, 13.3338, 
              13.55, 13.775, 14, 14.2463, 14.5, 14.765, 15, 15.1537, 15.3, 
              15.525, 15.75, 15.8963, 16.05, 16.2963, 16.55, 16.7062, 16.9571, 
              17.4192, 18.04, 18.735, 19.2, 19.7925, 20.4, 20.9275, 21.4), 
              Longitude = c(88.1, 87.885, 87.7, 87.5575, 87.32, 87.1017, 
              86.9429, 86.8625, 86.7, 86.3436, 85.95, 85.685, 85.45, 85.16, 
              84.9, 84.7537, 84.6, 84.315, 84, 83.7237, 83.5, 83.36, 83.25, 
              83.1113, 82.95, 82.7462, 82.55, 82.4213, 82.3, 82.1137, 81.95, 
              81.8737, 81.85, 81.8462, 81.85, 81.8475, 81.8, 81.6687, 81.5, 
              81.3462, 81.2, 81.0488, 80.95, 80.9599, 81, 80.9788, 80.95, 
              80.9724, 80.95, 80.8087, 80.6, 80.3788, 80.15, 79.9423, 79.7857, 
              79.6735, 79.64, 79.7275, 79.7, 79.72, 79.8, 79.9348, 80.1), 
              yearRef = c(1990, 1990, 1990, 1990, 1990, 1990, 1990, 
              1990, 1990, 1990, 1990, 1990, 1990, 1990, 1990, 1990, 1990, 
              1990, 1990, 1990, 1990, 1990, 1990, 1990, 1990, 1990, 1990, 
              1990, 1990, 1990, 1990, 1990, 1990, 1990, 1990, 1990, 1990, 
              1990, 1990, 1990, 1990, 1990, 1990, 1990, 1990, 1990, 1990, 
              1990, 1990, 1990, 1990, 1990, 1990, 1990, 1990, 1990, 1990, 
              1990, 1990, 1990, 1990, 1990, 1990), monthRef = c(5, 5, 5, 
              5, 5, 5, 5, 5, 5, 5, 5, 5, 5, 5, 5, 5, 5, 5, 5, 5, 5, 5, 
              5, 5, 5, 5, 5, 5, 5, 5, 5, 5, 5, 5, 5, 5, 5, 5, 5, 5, 5, 
              5, 5, 5, 5, 5, 5, 5, 5, 5, 5, 5, 5, 5, 5, 5, 5, 5, 5, 5, 
              5, 5, 5)), class = "data.frame", row.names = c(NA, -63L))

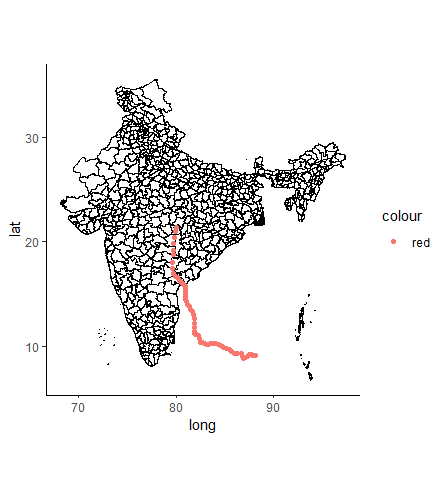
Plotting it in on a shapefile

library(raster)
library(sp)
temp.shp <- getData('GADM', country = 'IND', level = 2)

ggplot() + 
geom_polygon(data = temp.shp, aes(x = long, y = lat, group = group), fill = NA, colour = "black")  +
geom_point(data = lat_lonDat,  aes(x = Longitude, y = Latitude, colour = 'red')) +
coord_quickmap() +  theme_classic()   

enter image description here

From the storm data, I want to extract those rows (Latitude Longitude) when the storm was on the land i.e. intersected with polygon. I tried the approach from here:

Checking if points fall within polygon Shapefile

coordinates(lat_lonDat) <- ~ Latitude + Longitude
proj4string(lat_lonDat) <- proj4string(temp.shp)

over(lat_lonDat, temp.shp)

However, I am still getting NAs. What am I doing wrong?

1 Answer 1

1

It looks like you reversed Latitude and Longitude coordinates when you coerced to an sp points object.

library(sp)
library(raster)

india <- getData("GADM",country="IND",level=2)
pts <- structure(list(Latitude = c(9.1, 9.15755, 9.2, 9.21496, 9.06, 
              8.89169, 8.84286, 9.04619, 9.3, 9.31138, 9.3, 9.45992, 9.65, 
              9.76127, 9.85, 9.94991, 10.05, 10.1651, 10.25, 10.2725, 10.25, 
              10.1887, 10.15, 10.21, 10.3, 10.3163, 10.4, 10.6962, 11, 11.0975, 
              11.15, 11.2587, 11.45, 11.755, 12.15, 12.615, 13.05, 13.3338, 
              13.55, 13.775, 14, 14.2463, 14.5, 14.765, 15, 15.1537, 15.3, 
              15.525, 15.75, 15.8963, 16.05, 16.2963, 16.55, 16.7062, 16.9571, 
              17.4192, 18.04, 18.735, 19.2, 19.7925, 20.4, 20.9275, 21.4), 
              Longitude = c(88.1, 87.885, 87.7, 87.5575, 87.32, 87.1017, 
              86.9429, 86.8625, 86.7, 86.3436, 85.95, 85.685, 85.45, 85.16, 
              84.9, 84.7537, 84.6, 84.315, 84, 83.7237, 83.5, 83.36, 83.25, 
              83.1113, 82.95, 82.7462, 82.55, 82.4213, 82.3, 82.1137, 81.95, 
              81.8737, 81.85, 81.8462, 81.85, 81.8475, 81.8, 81.6687, 81.5, 
              81.3462, 81.2, 81.0488, 80.95, 80.9599, 81, 80.9788, 80.95, 
              80.9724, 80.95, 80.8087, 80.6, 80.3788, 80.15, 79.9423, 79.7857, 
              79.6735, 79.64, 79.7275, 79.7, 79.72, 79.8, 79.9348, 80.1), 
              yearRef = c(1990, 1990, 1990, 1990, 1990, 1990, 1990, 
              1990, 1990, 1990, 1990, 1990, 1990, 1990, 1990, 1990, 1990, 
              1990, 1990, 1990, 1990, 1990, 1990, 1990, 1990, 1990, 1990, 
              1990, 1990, 1990, 1990, 1990, 1990, 1990, 1990, 1990, 1990, 
              1990, 1990, 1990, 1990, 1990, 1990, 1990, 1990, 1990, 1990, 
              1990, 1990, 1990, 1990, 1990, 1990, 1990, 1990, 1990, 1990, 
              1990, 1990, 1990, 1990, 1990, 1990), monthRef = c(5, 5, 5, 
              5, 5, 5, 5, 5, 5, 5, 5, 5, 5, 5, 5, 5, 5, 5, 5, 5, 5, 5, 
              5, 5, 5, 5, 5, 5, 5, 5, 5, 5, 5, 5, 5, 5, 5, 5, 5, 5, 5, 
              5, 5, 5, 5, 5, 5, 5, 5, 5, 5, 5, 5, 5, 5, 5, 5, 5, 5, 5, 
              5, 5, 5)), class = "data.frame", row.names = c(NA, -63L))

Here we coerce to a SpatialPointsDataFrame. The [X,Y] coordinate order is Longitude, Latitude.

coordinates(pts) <- ~ Longitude + Latitude 
  proj4string(pts) <- proj4string(india)

A simple way to subset points using sp::over is to pull a column that you know has complete values in the polygon data and index based on NA's (non intersecting values). We can then plot results.

full.ext <- as(extent(pts), "SpatialPolygons")
pts <- pts[which(!is.na(over(pts, india)$GID_0)),]

plot(india)
  plot(full.ext, add=TRUE)
    plot(pts, pch=20, col="red", add=TRUE) 

Your Answer

By clicking “Post Your Answer”, you agree to our terms of service and acknowledge you have read our privacy policy.

Not the answer you're looking for? Browse other questions tagged or ask your own question.