21

Zillow has a set of shapefiles for different neighborhoods of major US cities. I wanted to check if certain buildings were present in certain neighborhoods using R:

library(rgeos)
library(sp)
library(rgdal)

df <- data.frame(Latitude =c(47.591351, 47.62212,47.595152),
                 Longitude = c(-122.332271,-122.353985,-122.331639),
                 names = c("Safeco Field", "Key Arena", "Century Link"))
coordinates(df) <- ~ Latitude + Longitude

wa.map <- readOGR("ZillowNeighborhoods-WA.shp", layer="ZillowNeighborhoods-WA")

sodo <- wa.map[wa.map$CITY == "Seattle"  & wa.map$NAME == "Industrial District", ]

I can plot without any issues

plot(sodo)
points(df$Latitude ~ df$Longitude, col = "red", cex = 1)
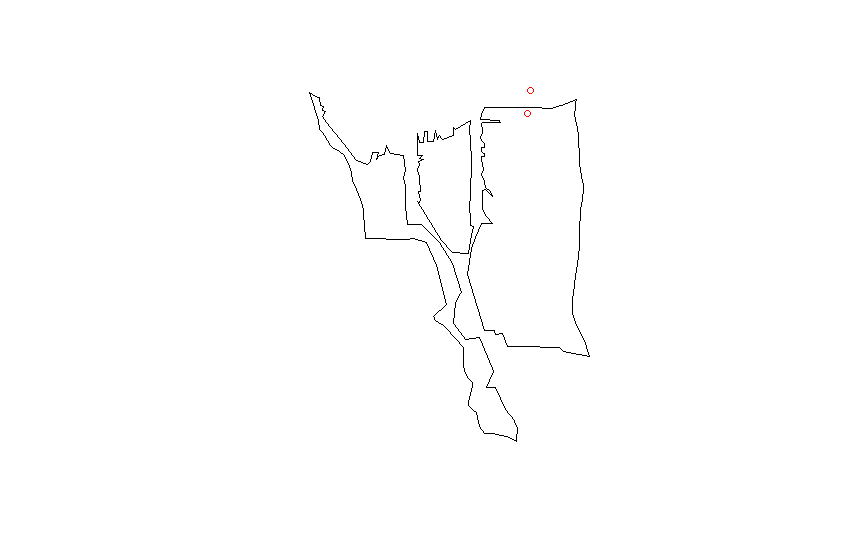
enter image description here

I match the proj4 string from the shapefile to my data.frame

CRSobj <- CRS("+proj=longlat +datum=NAD83 +no_defs +ellps=GRS80 +towgs84=0,0,0 ")
df@proj4string <- CRSobj

over(df, sodo)

This just gives me a bunch of NA values. I have tried this answer

spp <- SpatialPoints(df)
spp@proj4string <- CRSobj
over(spp, sodo)

but still get only NA values. Any ideas what else I should try?

3 Answers 3

21

The spatial data.frame is not correctly formed. This might work:

library(rgeos)
library(sp)
library(rgdal)

wa.map <- readOGR("ZillowNeighborhoods-WA.shp", layer="ZillowNeighborhoods-WA")

sodo <- wa.map[wa.map$CITY == "Seattle"  & wa.map$NAME == "Industrial District", ]

# Don't use df as name, it is an R function
# Better to set longitudes as the first column and latitudes as the second
dat <- data.frame(Longitude = c(-122.332271,-122.353985,-122.331639),
                  Latitude =c(47.591351, 47.62212,47.595152),
                  names = c("Safeco Field", "Key Arena", "Century Link"))
# Assignment modified according
coordinates(dat) <- ~ Longitude + Latitude
# Set the projection of the SpatialPointsDataFrame using the projection of the shapefile
proj4string(dat) <- proj4string(sodo)

over(dat, sodo)
#  STATE COUNTY    CITY                NAME REGIONID
#1    WA   King Seattle Industrial District   271892
#2  <NA>   <NA>    <NA>                <NA>       NA
#3  <NA>   <NA>    <NA>                <NA>       NA

over(sodo, dat)
#           names
#122 Safeco Field
8

I've just been doing the same thing. Pascal's answer almost covers it but you may need two extra steps as below.

#After you create your list of latlongs you must set the proj4string to longlat
proj4string(dat) <- CRS("+proj=longlat")

#Before you re-set the proj4string to the one from sodo you must actually convert #your coordinates to the new projection
dat <- spTransform(dat, proj4string(sodo))
2
  • It is not clear to me in which cases these additional steps are needed. For me the solution of the answer by user32309 was good enough.
    – djhurio
    Commented Nov 27, 2017 at 22:00
  • 3
    It depends on what format your data is in. If its in projection A and you just want to declare that you use proj4string and you should be good. But if its in projection B and you need to actuallly do a conversion to projection A you need to use spTransform.
    – John Curry
    Commented Nov 28, 2017 at 22:44
7

I used a similar approach to the accepted answer in this post but was never really satisfied with it so I looked into alternatives and found the sf library.

And using this library you can then write code like this:

library(sf)
# Shapefile from ABS: 
# https://www.abs.gov.au/AUSSTATS/[email protected]/DetailsPage/1270.0.55.004July%202016?OpenDocument
map = read_sf("data/ABS/shapes/SUA_2016_AUST.shp")

pnts_sf <- st_as_sf(pnts, coords = c('y', 'x'), crs = st_crs(map))

pnts <- pnts_sf %>% mutate(
  intersection = as.integer(st_intersects(geometry, map))
  , area = if_else(is.na(intersection), '', map$SUA_NAME16[intersection])
) 

pnts

Output:

         geometry intersection area    
*     <POINT [°]>        <int> <chr>   
1 (138.62 -34.92)           79 Adelaide
2 (138.58 -34.93)           79 Adelaide
3 (138.52 -34.95)           79 Adelaide
4 (152.71 -27.63)           60 Brisbane
5 (153.01 -27.57)           60 Brisbane
6  (150.73 -33.9)           31 Sydney  
7 (150.99 -33.92)           31 Sydney 

I posted this code on another post which was a similar question, here: Identify polygon containing point with R sf package

1
  • How can I do this with sf package if the x and y point are a point shapefile? and how can I after save the selected points inside the polygon as new shapefile with same CRS as original point shapefile?
    – Gab
    Commented Apr 17, 2020 at 7:28

Your Answer

By clicking “Post Your Answer”, you agree to our terms of service and acknowledge you have read our privacy policy.

Not the answer you're looking for? Browse other questions tagged or ask your own question.