15

I would like to be able to map geocoded coordinates to a region on a .shp file in R using the sf package. I can load up the map and plot it but I am struggling with the code to return the region for a geocoded address.

library(sf)
library(ggplot2)

tt <- read_sf(dsn=path.expand(path), layer = "dhb2015", quiet = TRUE)
#tt <- st_transform(tt, 4326) #Not sure if this step is required with sf?
tt

Simple feature collection with 22 features and 3 fields
geometry type:  MULTIPOLYGON
dimension:      XY
bbox:           xmin: -177.3579 ymin: -47.72405 xmax: 178.8362 ymax: -33.9585
epsg (SRID):    4326
proj4string:    +proj=longlat +datum=WGS84 +no_defs
# A tibble: 22 x 4
   code  region           Shape_Leng                                                                                geometry
   <chr> <chr>                 <dbl>                                                                     <MULTIPOLYGON [°]>
 1 01    Northland           1651929 (((174.2735 -36.28929, 174.2735 -36.28931, 174.2737 -36.28929, 174.2737 -36.28932, 1...
 2 02    Waitemata            927392 (((174.5034 -37.0508, 174.5034 -37.05086, 174.5033 -37.05085, 174.5031 -37.05076, 17...
 3 03    Auckland             778190 (((175.1572 -36.92584, 175.1571 -36.92585, 175.157 -36.92583, 175.1569 -36.92575, 17...
 4 04    Counties Manukau     664223 (((174.9167 -36.87379, 174.9168 -36.87379, 174.9169 -36.87378, 174.9169 -36.8738, 17...
 5 05    Waikato             1498296 (((175.9005 -37.22147, 175.9005 -37.22149, 175.9004 -37.22149, 175.9004 -37.22145, 1...
 6 06    Lakes                623669 (((176.2863 -37.93705, 176.2879 -37.93705, 176.2881 -37.93704, 176.3047 -37.93707, 1...
 7 07    Bay of Plenty        946874 (((176.1953 -37.63174, 176.1952 -37.63187, 176.1951 -37.63188, 176.1949 -37.63185, 1...
 8 08    Tairawhiti           689549 (((178.0497 -38.70606, 178.0497 -38.70606, 178.0498 -38.70604, 178.0499 -38.70588, 1...
 9 09    Taranaki             565796 (((174.0128 -39.06098, 174.0127 -39.06099, 174.0124 -39.06096, 174.0123 -39.06091, 1...
10 10    Hawke's Bay          945440 (((176.989 -39.85827, 176.9889 -39.85829, 176.9887 -39.85827, 176.9886 -39.85821, 17...
# ... with 12 more rows

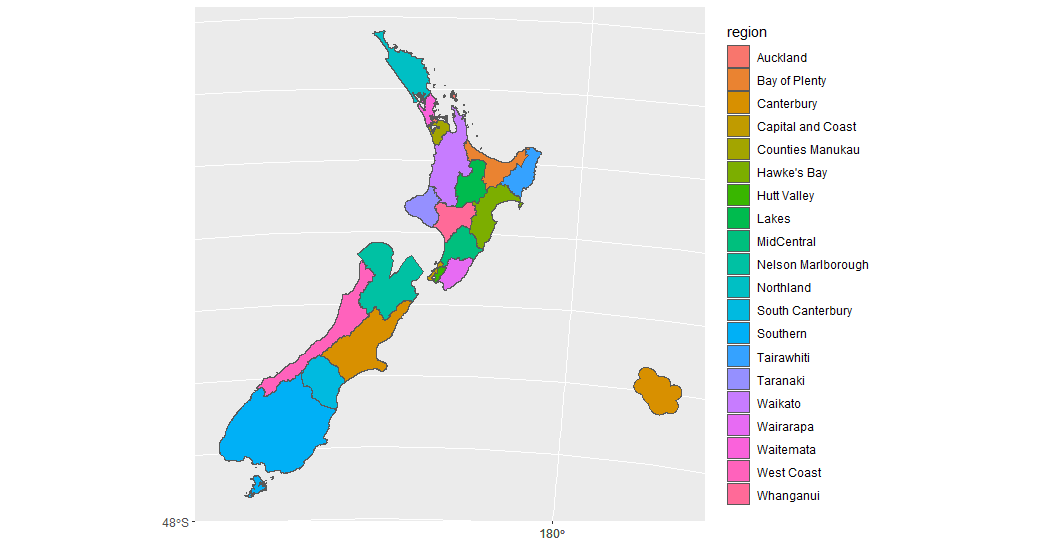
tt %>% 
  ggplot() +
  geom_sf(aes(fill = region))

enter image description here

I would like to be able to return the region (polygon) where a point is located.

loc=data.frame(
  lon= c(175.278655),
  lat= c(-37.733997),
)

I am fairly new to geographic data and would like to make use of the tidyverse and sf packages if possible.

1
  • 2
    Try sf::st_intersects
    – rcs
    Commented May 14, 2018 at 7:27

5 Answers 5

16

What you are looking can be done using sf::st_intersects() as commented. I provide a full working example using USA states.

library(magrittr)
library(ggplot2)
library(sf)

tt <- read_sf(path, "USA_adm1")

# subset some states to make it plot faster
tt1 <- tt[tt$NAME_1 %in% c("South Dakota", "Wyoming",  
                       "Nebraska", "Iowa"), ]

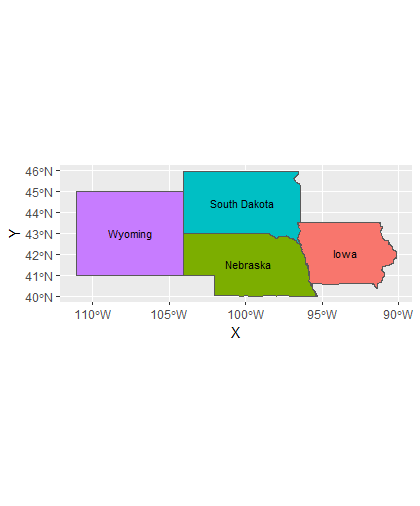
I've added labels over the polygons centroids and now the plot looks like that.

Regions' plot

Now for the actual work. Assume a data.frame of lat-lon values.

pnts
           x        y
1 -105.08798 43.27392
2  -99.61295 43.48426
3  -96.22951 43.05443
4  -92.35393 43.04529
5  -96.59861 43.14589
6 -101.45847 42.80751
7 -106.87197 44.22843

pnts$region <- apply(pnts, 1, function(row) {  
   # transformation to palnar is required, since sf library assumes planar projection 
   tt1_pl <- st_transform(tt1, 2163)   
   coords <- as.data.frame(matrix(row, nrow = 1, 
     dimnames = list("", c("x", "y"))))   
   pnt_sf <- st_transform(st_sfc(st_point(row),crs = 4326), 2163)
   # st_intersects with sparse = FALSE returns a logical matrix
   # with rows corresponds to argument 1 (points) and 
   # columns to argument 2 (polygons)

   tt1_pl[which(st_intersects(pnt_sf, tt1_pl, sparse = FALSE)), ]$NAME_1 
})

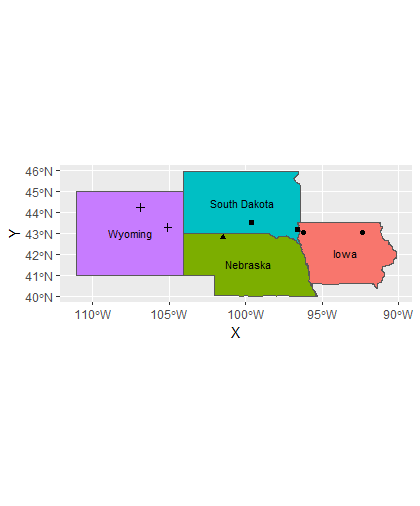
The results are shown below

           x        y       region
1 -105.08798 43.27392      Wyoming
2  -99.61295 43.48426 South Dakota
3  -96.22951 43.05443         Iowa
4  -92.35393 43.04529         Iowa
5  -96.59861 43.14589 South Dakota
6 -101.45847 42.80751     Nebraska
7 -106.87197 44.22843      Wyoming

and in a plot

plot with points

EDIT - I add another version for this operation, inspired by a very important comment made by spacedman. This would save some computing time, in particular form datasets with multiple points/polygons or complex geometries.

pnts <- data.frame(
"x" = c(-105.08798, -99.61295, -96.22951, 
        -92.35393, -96.59861, -101.45846, -106.87197),
"y" = c(43.27392, 43.48426, 43.05443, 43.04529, 
        43.14589, 42.80751, 44.22843))

# create a points collection
pnts_sf <- do.call("st_sfc",c(lapply(1:nrow(pnts), 
function(i) {st_point(as.numeric(pnts[i, ]))}), list("crs" = 4326))) 

pnts_trans <- st_transform(pnts_sf, 2163) # apply transformation to pnts sf
tt1_trans <- st_transform(tt1, 2163)      # apply transformation to polygons sf

# intersect and extract state name
pnts$region <- apply(st_intersects(tt1_trans, pnts_trans, sparse = FALSE), 2, 
               function(col) { 
                  tt1_trans[which(col), ]$NAME_1
               })
6
  • 6
    Do the transformations once and then do the intersection wit a single st_intersection(stpnts, tt1_pl) rather than slowing things down with apply etc.
    – Spacedman
    Commented May 14, 2018 at 12:17
  • @Spacedman - good point
    – dof1985
    Commented May 15, 2018 at 12:46
  • Thanks - works perfectly! What actually happens with the st_transform step? Is the 2163 a map projection? How does that work with the crs = 4326? Thanks for your help, great to get this working!
    – jmc
    Commented May 18, 2018 at 21:14
  • @jmc The 2163 map projection is a metric projection for the U.S. whereas for New Zealand you should use another projection. Although it works also with 4326, st_transform assumes a metric projection and might cause some errors if a geographic coordinate system is being used instead.
    – dof1985
    Commented May 21, 2018 at 6:49
  • Thanks for the clarification. The 2153 projection seems to work well for NZ as far as I can tell. It appears to be able to discriminate between coordinates very close to region borders correctly. Do you have any suggestions on how can I find out the most appropriate projection to use for NZ?
    – jmc
    Commented May 22, 2018 at 21:27
7

Here is an example of how you can do this, I'm using the significant urban areas shapefile from the Australian Bureau of Statistics.

Firstly this is what my pnts variable looks like:

      x     y
  <dbl> <dbl>
1 -34.92 138.62
2 -34.93 138.58
3 -34.95 138.52
4 -27.63 152.71
5 -27.57 153.01
6 -33.9  150.73
7 -33.92 150.99

And here is my code:

library(sf)
# Shapefile from ABS: 
# https://www.abs.gov.au/AUSSTATS/[email protected]/DetailsPage/1270.0.55.004July%202016?OpenDocument
map = read_sf("data/ABS/shapes/SUA_2016_AUST.shp")

pnts_sf <- st_as_sf(pnts, coords = c('y', 'x'), crs = st_crs(map))

pnts <- pnts_sf %>% mutate(
  intersection = as.integer(st_intersects(geometry, map))
  , area = if_else(is.na(intersection), '', map$SUA_NAME16[intersection])
) 

pnts

Output:

         geometry intersection area    
*     <POINT [°]>        <int> <chr>   
1 (138.62 -34.92)           79 Adelaide
2 (138.58 -34.93)           79 Adelaide
3 (138.52 -34.95)           79 Adelaide
4 (152.71 -27.63)           60 Brisbane
5 (153.01 -27.57)           60 Brisbane
6  (150.73 -33.9)           31 Sydney  
7 (150.99 -33.92)           31 Sydney 

FYI those coordinates are locations of weather stations, I used this approach to identify weather stations located in major cities in Australia.

3

To find the countries of a data.frame with lat-long coordinates, convert them to an sf object with sf::st_as_sf(mydf, coords=c("lon","lat"), crs=4326).
Then intersect it with a map of polygons. This is vectorized, so no loops are needed.
Here's a complete working example:

# Dataframe with latlong coordinates:
d <- read.table(sep=",", header=TRUE, text=
"lat, long
55.685143, 12.580008
52.514464, 13.350137
50.106452, 14.419989
48.847003, 2.337213
51.505364, -0.164752")
dsf <- sf::st_as_sf(d, coords=c("long","lat"), crs=4326)

# Polygons of some countries:
if(!requireNamespace("rworldmap", quietly=TRUE)) install.packages("rworldmap")
map <- rworldmap::getMap()
countries <- c("AUT","BEL","CHE","DEU","DNK","FRA","GBR","CZE","LUX","NLD","POL")
map <- map[map@data$GU_A3 %in% countries, "ADMIN"]
map <- sf::st_as_sf(map)

# Plot for visual reference, uses sf::plot_sf:
plot(map, reset=FALSE)
plot(dsf, add=TRUE, reset=FALSE, pch=16, col="red", cex=1.5)
axis(1, line=-1) ; axis(2, line=-1, las=1)

# Find country of each coordinate:
int <- sf::st_intersects(dsf, map)
int
d$country <- as.character(map$ADMIN[unlist(int)])
d
1

I would like to add to Michael Gordon's code as I found it very useful but confounding until I found the solution.

I also wanted to find if given locations where in a polygon, in my case I was looking at electoral wards in the UK. I substituted my shape file and points but I wasn't getting any intersections, after much searching I started looking at the Coordinate Reference Systems (CRS) for my map and points which is where I would like to add to the code.

st_crs(map)

This will show the CRS of the map, in my case it produced the following output

 Coordinate Reference System:
  EPSG: 27700 
  proj4string: "+proj=tmerc +lat_0=49 +lon_0=-2 +k=0.9996012717 +x_0=400000 +y_0=-100000 +ellps=airy +towgs84=446.448,-125.157,542.06,0.15,0.247,0.842,-20.489 +units=m +no_defs"

Although

pnts_sf <- st_as_sf(pnts, coords = c('y', 'x'), crs = st_crs(map))

sets the map and points to the same CRS I was still not getting any intersections. A bit more googling led me to the fact that there wouldn't be any intersect as the CRS needs to be a Longitude and Latitude projection.

In order to do this after creating the map I added

map <- st_transform(map,crs=4326)

Now when I run

st_crs(map)

I get

Coordinate Reference System:
  EPSG: 4326 
  proj4string: "+proj=longlat +datum=WGS84 +no_defs"

Now I get intersection and appreciate how simple this code is.

1

A quick and simple solution can be achieved by using st_intersection instead of st_intersects:

nc = system.file("gpkg/nc.gpkg", package="sf") %>%
  read_sf()  %>% st_transform(2163) # transform to planar as required by st_intersection()

p = st_sfc(st_point(c(-78.34046, 35.017)) , crs = 4267) %>% 
  st_transform(2163) # transform to  planar as required by st_intersction()

st_intersection(nc, p)$NAME

Note: st_intersection does work differently than st_intersects as discussed here: https://stackoverflow.com/questions/62442150/why-use-st-intersection-rather-than-st-intersects. So this solution might not work in all cases or for large datasets, but for this particular type of question it does.

Your Answer

By clicking “Post Your Answer”, you agree to our terms of service and acknowledge you have read our privacy policy.

Not the answer you're looking for? Browse other questions tagged or ask your own question.