1

I have a function to get an average value per month for a band from an image collection. Full code is here.

var dat = ee.ImageCollection('NOAA/CDR/SST_WHOI/V2').select('sea_surface_temperature')
    .filterDate(ee.Date('1990-01-01'), ee.Date('2000-01-01'))
    .filterBounds(ROI);

// month data for dataset

var startyear = 1990; 
var endyear = 1999; 

var startmonth = 1;
var endmonth = 12;

var startdate = ee.Date.fromYMD(startyear, startmonth, 1);
var enddate = ee.Date.fromYMD(endyear , endmonth, 1);

var years = ee.List.sequence(startyear, endyear);

var months = ee.List.sequence(1, 12);
var monthlySST =  ee.ImageCollection.fromImages(
  years.map(function (y) {
   return months.map(function(m) {
      var w = dat.filter(ee.Filter.calendarRange(y, y, 'year'))
                .filter(ee.Filter.calendarRange(m, m, 'month'))
                .mean();
      return w.set('year', y)
          .set('month', m)
          .set('system:time_start', ee.Date.fromYMD(y, m, 1));

    });
  }).flatten()
);

In order to extract the data I've been plotting a graph then exporting as a csv.

print(ui.Chart.image.series(monthlySST, ROI, ee.Reducer.mean(), 4000)
     .setOptions({
     title: " Sea surface temperature mean by month of the year ",
     hAxis: {title: 'Time'},
     vAxis: {title: ' Sea surface temperature (°C)'},
     colors: ['#EF851C'],
     pointSize: 3}));

However, I'm trying to export a very large time period. And the graph times out or exceeds user memory. I tried exporting the image collection as a table but it doesn't include the the mean monthly band value in the table. Is there anyway of doing this?

1 Answer 1

0

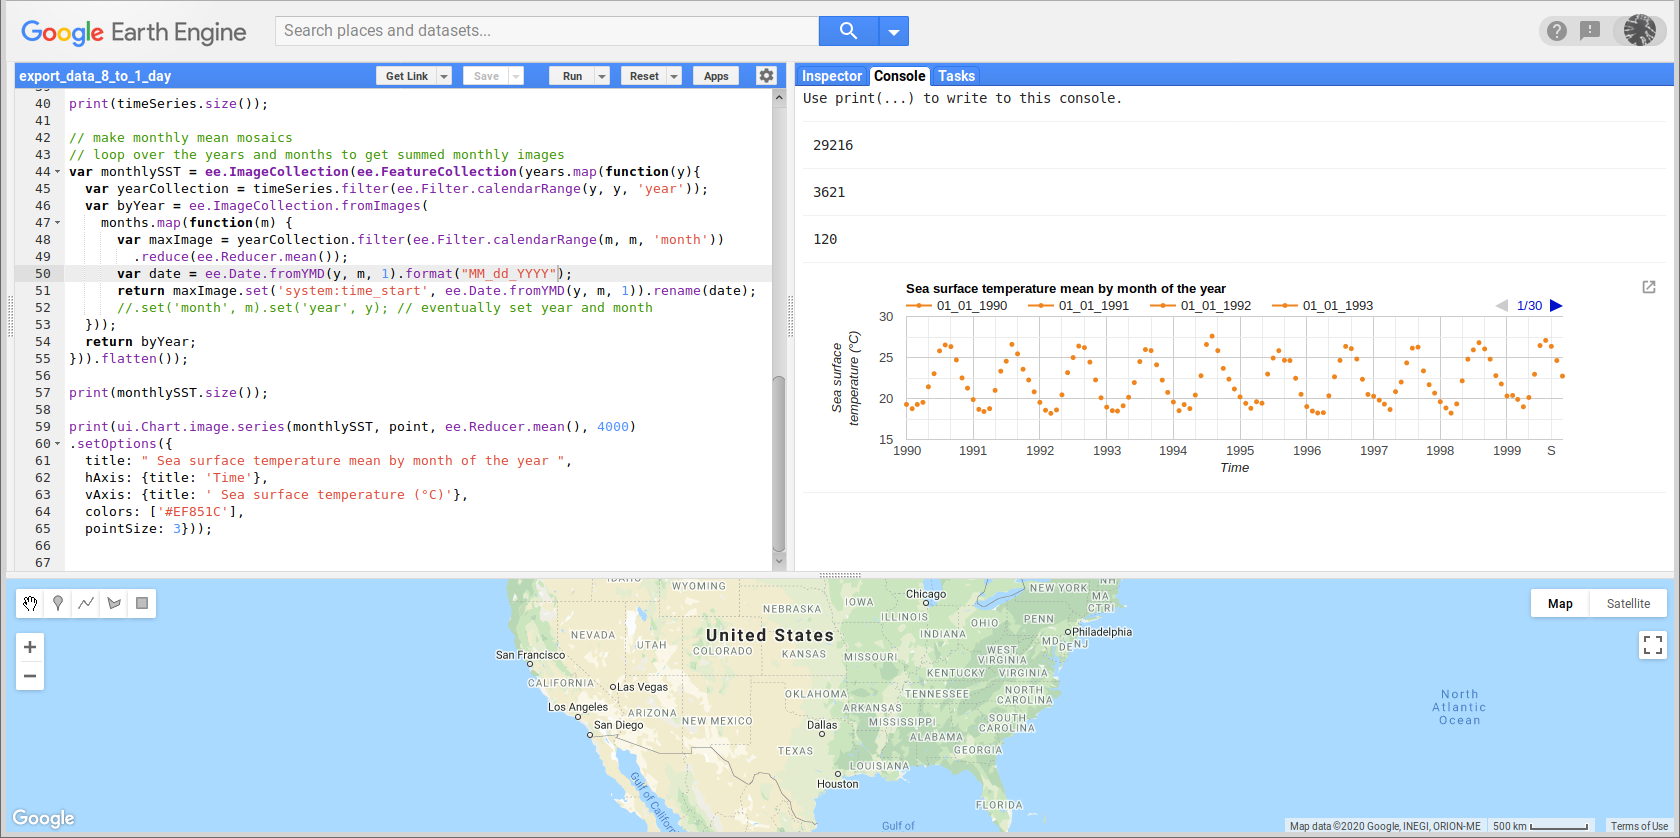
Probably, the issue is because 'NOAA/CDR/SST_WHOI/V2' product has 8 values per day and your series has 29216 values instead 3621 (number expected for series with one value per day). So, it exceeds user memory. You can overcome this problem taking one image per day (in this case as median); as in following script (I used an arbitrary point in Atlantic Ocean).

var dat = ee.ImageCollection('NOAA/CDR/SST_WHOI/V2')
    .select('sea_surface_temperature')
    .filterDate('1990-01-01', '2000-01-01');

var point = ee.Geometry.Point(-61.18632812500001, 37.11188126160896); 

print(dat.size());

// month data for dataset

var startyear = 1990; 
var endyear = 1999; 

var startmonth = 1;
var endmonth = 12;

var startdate = ee.Date.fromYMD(startyear, startmonth, 1);
var enddate = ee.Date.fromYMD(endyear , endmonth, 1);

var years = ee.List.sequence(startyear, endyear);

var months = ee.List.sequence(1, 12);

var days = enddate.difference(startdate, 'days');
var daysStep = 1;
var timeSeries = ee.ImageCollection(
  ee.List.sequence(0, days.subtract(1), daysStep)
    .map(function (offsetDays) {
      var start = startdate.advance(offsetDays, 'days');
      var end = start.advance(daysStep, 'days');
      var composite = dat
        .filterDate(start, end)
        .median(); // You need to decide how to combine the images
      return composite
        .set('system:time_start', start.millis())
        .set('empty', composite.bandNames().size().eq(0));
    })
  ).filterMetadata('empty', 'equals', 0);

print(timeSeries.size());

// make monthly mean mosaics
// loop over the years and months to get summed monthly images
var monthlySST = ee.ImageCollection(ee.FeatureCollection(years.map(function(y){
  var yearCollection = timeSeries.filter(ee.Filter.calendarRange(y, y, 'year'));
  var byYear = ee.ImageCollection.fromImages(
    months.map(function(m) {
      var maxImage = yearCollection.filter(ee.Filter.calendarRange(m, m, 'month'))
        .reduce(ee.Reducer.mean()); 
      var date = ee.Date.fromYMD(y, m, 1).format("MM_dd_YYYY");
      return maxImage.set('system:time_start', ee.Date.fromYMD(y, m, 1)).rename(date);
      //.set('month', m).set('year', y); // eventually set year and month 
  }));
  return byYear;
})).flatten());

print(monthlySST.size());

print(ui.Chart.image.series(monthlySST, point, ee.Reducer.mean(), 4000)
.setOptions({
  title: " Sea surface temperature mean by month of the year ",
  hAxis: {title: 'Time'},
  vAxis: {title: ' Sea surface temperature (°C)'},
  colors: ['#EF851C'],
  pointSize: 3}));

After running above script in Editor of GEE, I got result of following image. Graph was finally plotted.

enter image description here

1

Your Answer

By clicking “Post Your Answer”, you agree to our terms of service and acknowledge you have read our privacy policy.

Not the answer you're looking for? Browse other questions tagged or ask your own question.