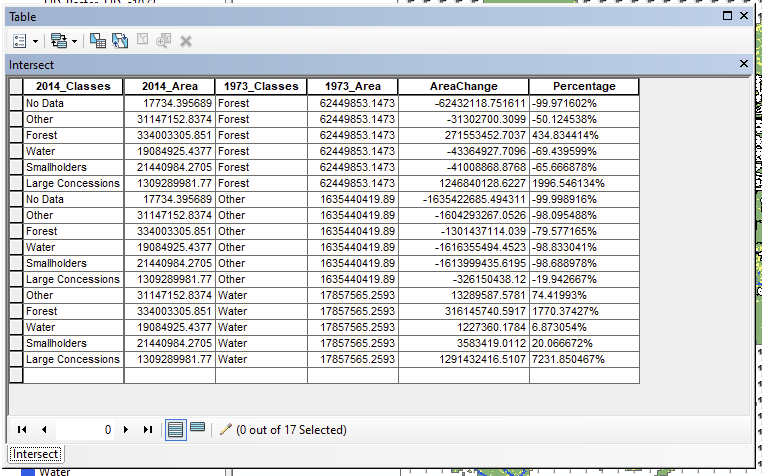
I am attempting to workout landcover change between two classified landcover maps. Ideally I want to show percentage change between the years per landcover type. I think I have done this but I am unsure whether my calculations are correct as the percentages seem to be very high...
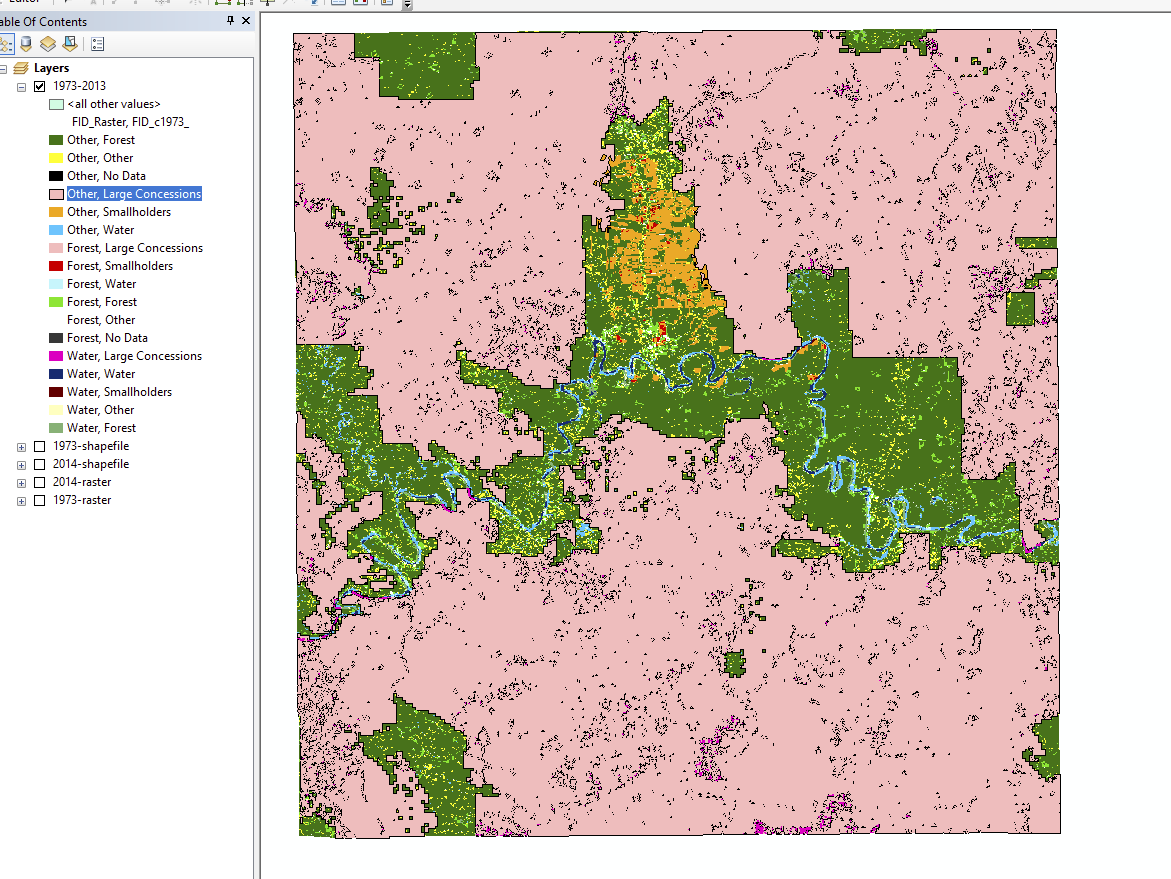
Also, my main interest in the study is seeing how palm oil (large concessions and smallholders), has caused habitat loss (in this case loss of forest) from 1973 - 2014. Is there an elegant way of showing this in both map form and also graph/table form? This is the current landcover map I have made.
I haven't been able to work out a solution as of yet.


