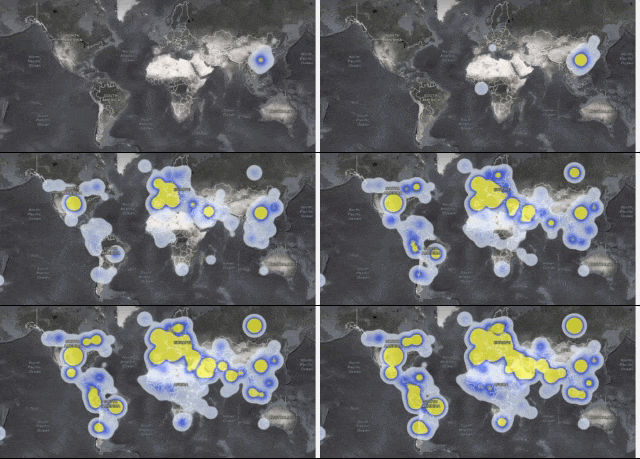
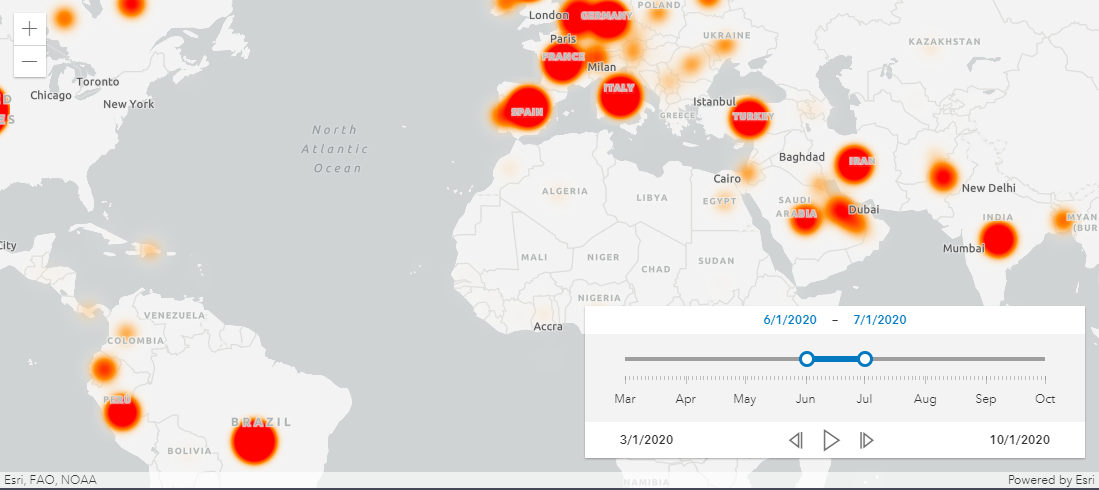
I am trying to create a time series of COVID data moving across the globe. For now, I'm trying to use a heatmap to do it. Using this COVID19_Time_Series_Combined (which pulls data from here), I created my own version using ArcGIS online, which you can view here: https://arcg.is/0L1e1K. All I really did was change some styling for the basemap and renderer, and customize the time slider. For a quick reference of what the ArcGIS online map produces, here's a gif:
This may not be the best visualization for this data, but that's what I'm trying to create in the JS API for now.
I pull in the layer and apply a heatmap renderer like so:
   var covidLayer = new FeatureLayer({
      url: <url mentioned above>,
      outFields: ['*'],
      renderer: {
         type: "heatmap",
         field: "Confirmed", // "Deaths" is also interesting as a time series
         colorStops: [ // placeholder for now
           { ratio: 0, color: "rgba(255, 255, 255, 0)" },
           { ratio: 0.5, color: "rgba(255, 140, 0, 1)" },
           { ratio: 1, color: "rgba(255, 0, 0, 1)" }
         ],
         minPixelIntensity: 0,
         maxPixelIntensity: 5000000
      },
      popupTemplate: {
         title: "{Date}"
      }
   })
I customized the time slider a bit, and then use a .watch to watch when the timeslider changes. On the change, I grab the timeExtent of the timeslider, and apply a filter to the layer to only use that time extent:
   timeSlider.watch("timeExtent", function(value){
      covidLayerView.effect = {
         filter: {
            timeExtent: value
         },
         excludedEffect: "grayscale(20%) opacity(12%)"
      }
   })
Unfortunately, this is not working. I seem to only be getting the cumulative result of all the data from all dates on my map, rather than just the data for that given time period. There is no change as the time slider moves.
I also tried filtering the layer using an SQL phrase, with no better results:
      // inside timeSlider.watch

      const start = value.start.getTime()
      const end = value.end.getTime()

      covidLayerView.effect = {
         filter: {
            where: `Date >= '${start}' AND Date <= '${end}'`
         },
         excludedEffect: "grayscale(20%) opacity(12%)"
      }
What does work is using a simple point renderer on the layer, with a visual variable, like this:
var covidLayer = new FeatureLayer({
      url: <url>,
      outFields: ['*'],
      renderer: {
         type: "simple",
         field: "Confirmed",
         symbol: {
            type: "simple-marker",
            size: 6,
            color: "black",
            outline: {
               width: 0.5,
               color: "white"
            }
         },
         visualVariables: [
            {
               type: 'size',
               field: 'Confirmed',
               stops: [
                  {
                    value: 1,
                    size: 3
                  },
                  {
                    value: 500,
                    size: 10
                  },
                  {
                     value: 100000,
                     size: 30
                   }
               ]
            }
         ]
      },
      popupTemplate: {
         title: "{Date}"
      }
   })
You can see this working properly with the timeslider in this codepen. I feel like this is a terrible way to visualize the data, but the timeslider is properly affecting the rendering of the data.
What is wrong with my setup that the rendering of the heatmap is not properly choosing only the data from the timeslider's time extent?
As an aside, I added a popup to the layer. In the simple renderer version, clicking on a point gives 202 popups, which is the total number of data points available across the entire time extent of the layer. I would expect to only have the number of data points available for that time extent, but I am getting data points for across the entire time extent.


