2

Let me preface this question by saying I am very novice with respect to GIS. With this in mind, I am looking to merge zip codes into sales territories. Instead of plotting data by zip code, I want to have a new file that lets me plot data for the respective territories.

Currently, I get around this by plotting the same value for all zip codes in the territory.

What is the best/easiest way to do accomplish this task? I am quite familiar with the programming language R, but usually can work through examples if this requires programming in other languages.

Many thanks in advance

5
  • I am not sure if I fully understand your problem/issue. If I understand correctly you have a number of polygons that represent Zip Codes (ie: 10 polygons all with different zip codes). You may have 6 sales regions within the zip code; and two zip codes may be in one sales area? If that is the case, you could create a new field in the attribute table and code the zip code polygons as a sales code. (ie: 10 zip code polygons have 6 sales codes). Commented Oct 23, 2012 at 16:38
  • Sorry for the confusion. A sales territory is made up of multiple zip codes. A zip code is only included in one sales territory. I want to create a new shp file where the polygons represent the territory. I have 304 territories across the US. My aim is to create a file that has the 304 polygons.
    – Btibert3
    Commented Oct 23, 2012 at 16:43
  • 3
    For most GIS products, the method would be called a "dissolve", which would remove the internal boundaries based upon a common attribute in an attribute field (column). Commented Oct 23, 2012 at 17:31
  • What GIS software do you have access to? Commented Oct 23, 2012 at 18:25
  • ArcMap, but I would like to stay within R if possible, unless there is a GUI-driven dummy-proof way to do this.
    – Btibert3
    Commented Oct 23, 2012 at 18:46

3 Answers 3

6

The unionSpatialPolygons function in the maptools package does this. You supply to it a SpatialPolygons and a vector which indicates which polygons (zip codes, in your example) belong to which aggregated polygon (sales areas).

EDIT:

The help page on unionSpatialPolygons has a good example of creating a grouping/indexing vector. It using counties in North Carolina, but the ideas are the same. Pulling from that example:

nc1 <- readShapePoly(system.file("shapes/sids.shp", package="maptools")[1],
 proj4string=CRS("+proj=longlat +datum=NAD27"))

Loads an example SpatialPolygonsDataFrame. Extract from this whatever information you need that is one-per-polygon. The example gets single coordinates associated with the polygon (centroid?)

lps <- coordinates(nc1)

You can see these together:

plot(nc1)
points(lps)
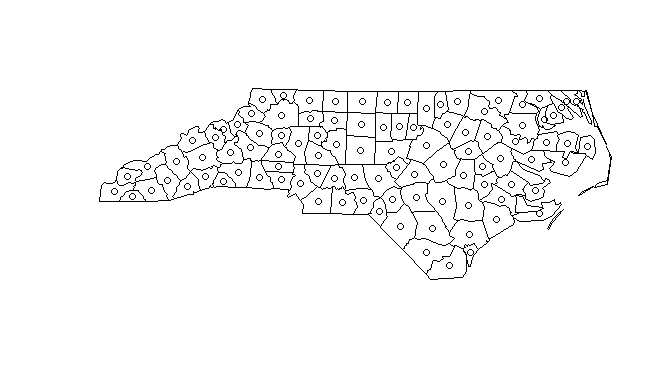
enter image description here

You could do something with nc1@data instead. Either have 100 entries, one for each polygon.

> dim(nc1@data)
[1] 100  14
> dim(lps)
[1] 100   2
> length(nc1@polygons)
[1] 100

Then use whatever transformation/mapping to derive a length 100 vector that indicates the groups.


The gpclibPermitStatus error probably means you don't have the rgeos package installed and/or have not agreed to the more restrictive license of gpclib.

7
  • What is the "best" way to create the vector for the unionSpatialPolygons function since it needs to be the same length? It errored out when I tried to pass it just a vector of the zip codes of interest (error= different lengths) as well as when a vector of T/F but the same length. Thanks.
    – Btibert3
    Commented Oct 23, 2012 at 19:15
  • gpclibPermitStatus() is the error I received when passing it a vector of T/F.
    – Btibert3
    Commented Oct 23, 2012 at 19:16
  • This is great. I had to install rgeos, gpclib, and call gpclibPermit() before the union would work. Two final questions if I could. I used a state with two markets (e.g. Rhode Island). I only supplied the zip's for one market, but the result was that the state was split perfectly into the 2 markets. How do I handle states w/ multiple markets. Second, is there a way I can assign a name to each market (RI 1, RI 2) etc? Huge help!!!
    – Btibert3
    Commented Oct 23, 2012 at 20:10
  • Nevermind, I figured out how to keep only the zip codes as one entity. I just need to figure out how to name each market and stitch them all back together, as there will be 304 in total. Huge help, thanks again!
    – Btibert3
    Commented Oct 23, 2012 at 20:31
  • You could just use gUnionCascaded in the rgeos package and avoid maptools and gpclib entirely. The rgeos library calls the C API topology library GEOS and is much more efficient than maptools. Commented Oct 25, 2012 at 0:58
0

Copy the zip code shapefile, select the zipcodes that fit into each territory and merge them. If don't want to do this manually you can script it with python. Check out arcpy if you're using ESRI's ArcMap, for QGIS pyqgis.

2
  • Thanks for the tip. Is there a way to do this in R?
    – Btibert3
    Commented Oct 23, 2012 at 16:43
  • You could use the over function in the sp package to provide an intersect table between regions and zip codes. Commented Oct 25, 2012 at 20:12
0

I'm not sure about how to program this but to do it manually you could select by attribute on your zip code shapefile to select all zip codes in a sales territory. Then you can can modify the attribute table to designate the sales territory. Once you've done this for each sale territory you can use the dissolve tool as mentioned above to dissovle based on the sales territory.

Your Answer

By clicking “Post Your Answer”, you agree to our terms of service and acknowledge you have read our privacy policy.

Not the answer you're looking for? Browse other questions tagged or ask your own question.