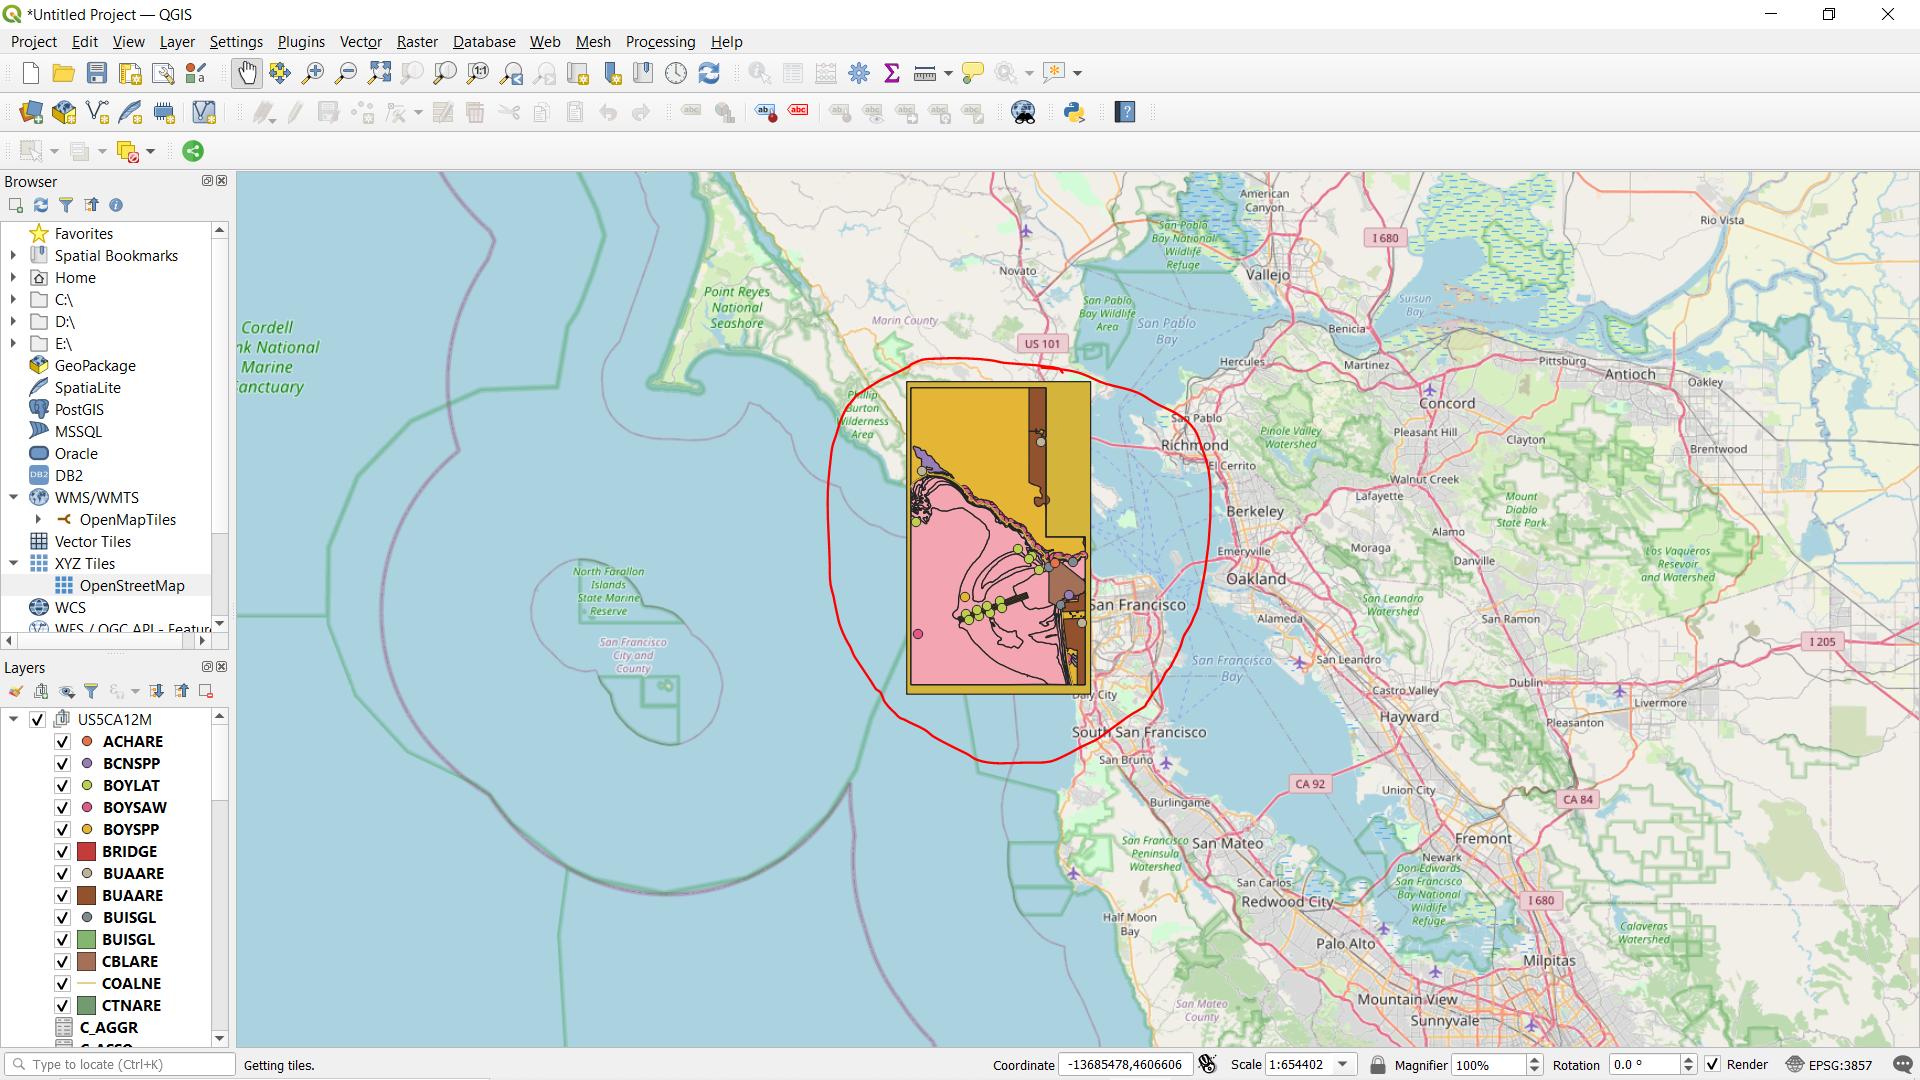
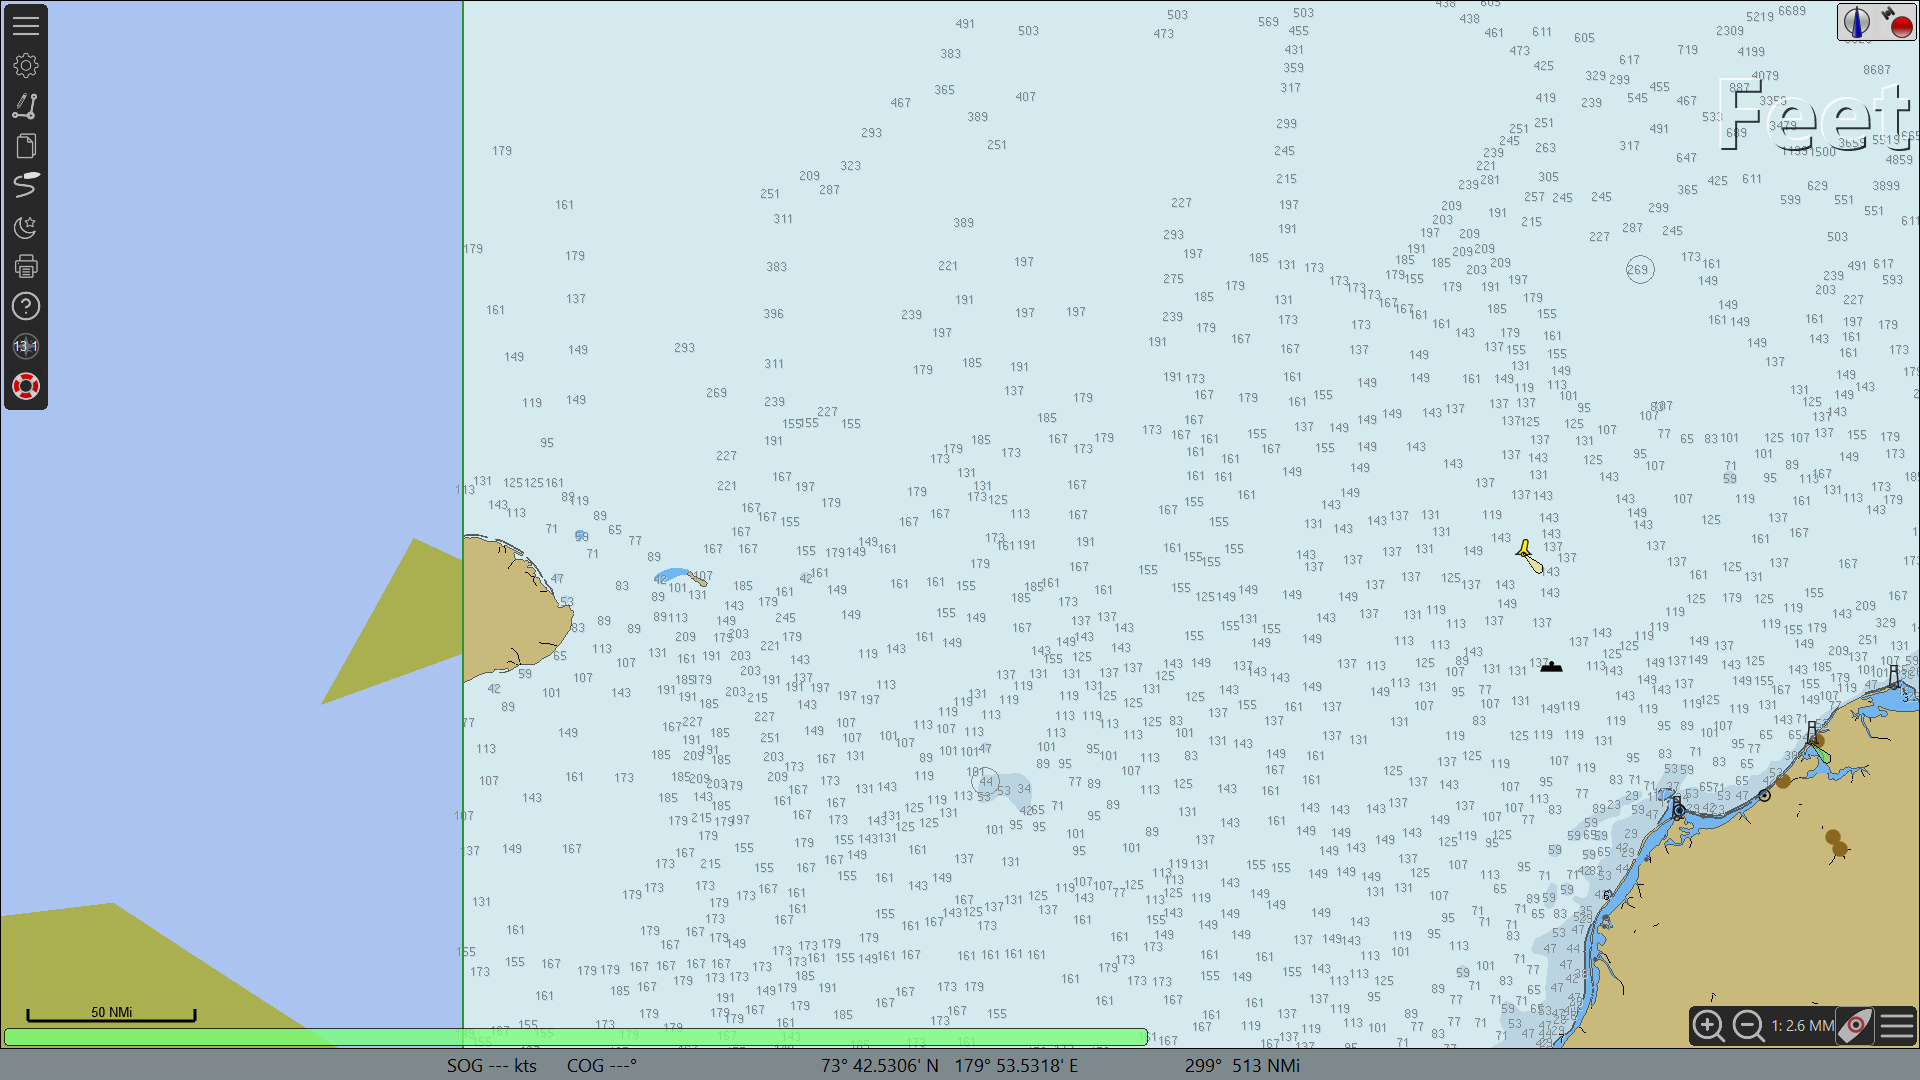
 I am trying to load ENC charts on QGIS but they are very odd when loaded. I read that one has to use ogr2ogr that converts these to shapefiles but that didn't work for me too. It shows up totally different. Can anyone guide. I downloaded sample charts from NOAA website.
-
1can you add a screen shot to show us what "very odd" means– Ian TurtonCommented Sep 30, 2020 at 16:06
-
1...and please cite the NOAA website URL.– Stu SmithCommented Oct 1, 2020 at 0:29
-
Edited the Post. Sorry for incomplete information– peterbrownCommented Oct 1, 2020 at 6:54
-
What are you expecting to see? That looks about right to me.– Dave CCommented Oct 2, 2020 at 13:00
-
@DaveC I edited the post for you to see what I'm expecting. I'd really appreciate any hints.– peterbrownCommented Oct 2, 2020 at 15:10
1 Answer
It seem that QGIS import the data correctly, if it look different it's because it's not symbolized (QGIS use random color on default symbology without any label) , you will need to do it manually or to find some pre-made QGIS style file to achieve the look you're after.
If you happens to read and understand french (or are not put off by automated translation) this blog post : "Affichage des cartes marines S57 dans QGis" will guide you to the whole import process including downloading and using symbology(download link).
This blog post also state that the relevant symbology is also accessible by using the "Resource Sharing" plugin and looking for the "Nautical symbols for marine charts" collection
EDIT : these link are quite old but still work (september 2016) and refer to old QGIS version (2.6 or 2.8) I haven't test it so I can't say if everything will just work or if you will need to adapt a bit...

