0

Using ArcGIS 10.8 I successfully ran through the following geoprocessing tools to complete a flow accumulation analysis of a USGS 1/3 arc second DEM of a portion of Houston, TX:

Fill --> Flow direction --> Flow accumulation

However, the results appear way more granular than I anticipated... Black lines are flow accumulations and red lines are neighborhood boundaries (see below screenshot).

I have no background in hydrology but given the geography/terrain of Houston I had anticipated seeing "ponds" or pools of accumulation rather than lines that follow only certain streets and the very centerlines of streams. How should these accumulation flows be interpreted considering the widespread flooding that happened after Hurricane Harvey and other major storms? What might be a target resolution that would allow me to derive larger "pools" of accumulation in this urban context?

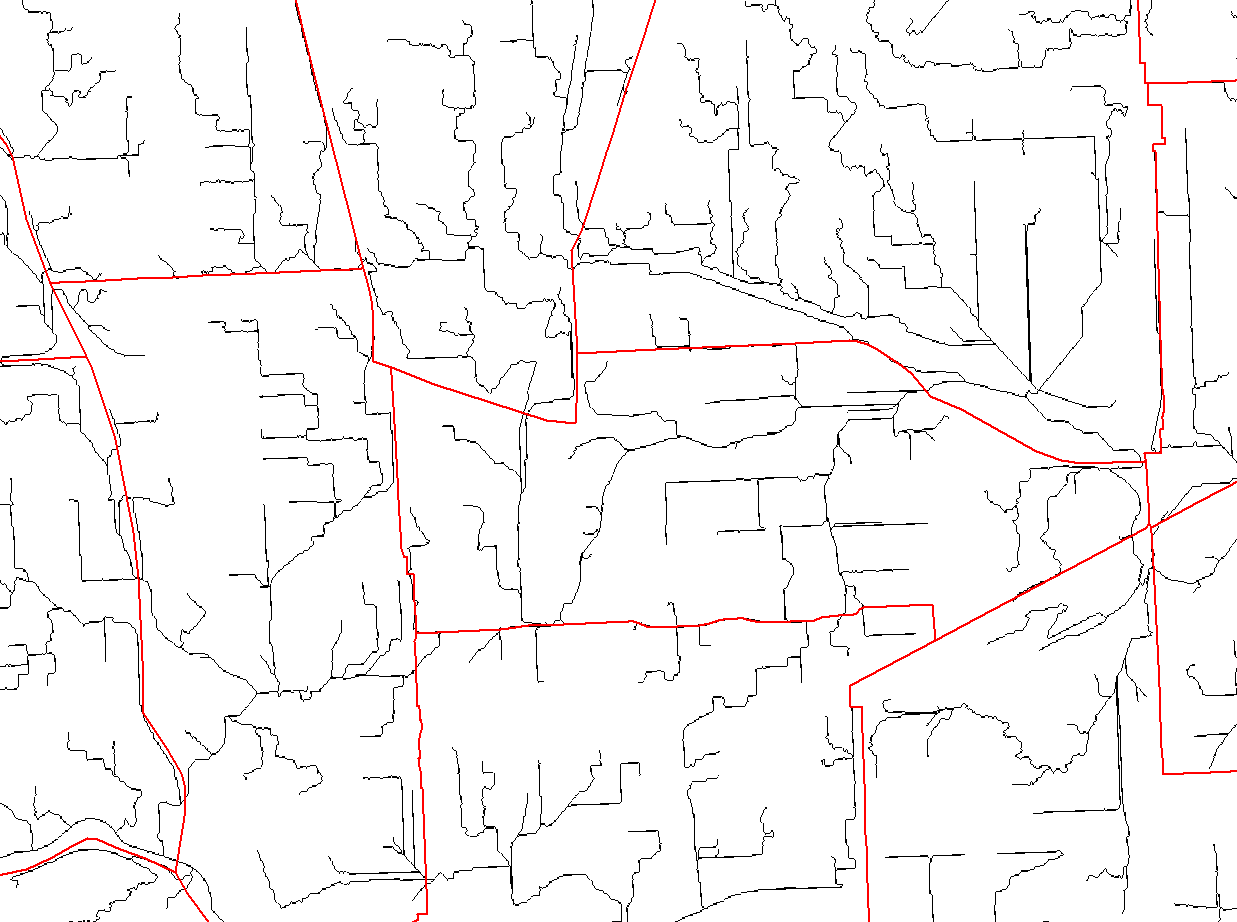
enter image description here

1
  • 1
    Try Con(Filled>DEM, Filled-DEM). It will give you depth in depressions (mostly behind roads). Slightly modified expression ,1) will produce their outlines.
    – FelixIP
    Commented Mar 3, 2021 at 0:13

1 Answer 1

3

If your question is something like 'where can I expect puddling and flooding you will not achieve this with a flow accumulation surface. Flow accumulation is returning a new grid where each value is the number of cells that flow into that cell. Your urban area has a vast network of storm water facilities that are not accounted for meaning your flow accumulation surface is not useful.

Flood modeling requires more sophisticated software (and a lot more data). See Hec-Ras or its many derivatives.

Your Answer

By clicking “Post Your Answer”, you agree to our terms of service and acknowledge you have read our privacy policy.

Not the answer you're looking for? Browse other questions tagged or ask your own question.