1

Here is my code in GEE to attempt this. NDVI values should range from -1 to 1, but because there are some bad pixels in the image, I have a few random values, such as -145 or 25. I am trying to mask out the image (turn those pixels to null) where those bad pixels exist, and keep all other values the same as the original NDVI calculation. I want to make sure the final output is an image which contains all original bands including NDVI.

The section for "badNDVI" is where I get the error: badNDVI.gt is not a function.

var aoi = 
    /* color: #d63000 */
    /* shown: false */
    ee.Geometry.Polygon(
        [[[-90.28893540845067, 30.185849313602084],
          [-90.48119615063817, 29.540364376709284],
          [-89.43200181470067, 29.37774455816459],
          [-89.21502183423192, 30.15260570786985]]]),
    landsat = ee.ImageCollection("LANDSAT/LC08/C01/T1_SR");

//Image reduction
//Image 3: August-November, 2020
var images = ee.ImageCollection(landsat
.filterBounds(point)
.filter(ee.Filter.calendarRange(2020, 2020, 'year')));
var growing = ee.ImageCollection(images
.filter(ee.Filter.calendarRange(8, 11, 'month'))
.sort('CLOUD_COVER_LAND')
.first()
);
var clipGrowing20 = growing.map(function(image){return image.clip(aoi)}) ;
print ('Growing Season 2020:', clipGrowing20);

var addNDVI = function(image) {
  var ndvi = image.select('NIR').subtract(image.select('Red'))
    .divide(image.select('NIR').add(image.select('Red')))
    .rename('NDVI');
  return image.addBands(ndvi);
};

var collectionNDVI20 = clipGrowing20.map(addNDVI);
print ('Not Masked NDVI 2020: ', collectionNDVI20);

var badNDVI = collectionNDVI20.select('NDVI');
var threshold1 = badNDVI.updateMask(badNDVI.gt(1))
var threshold2 = threshold1.updateMask(threshold1.lt(-1))
print (threshold2);

1 Answer 1

3

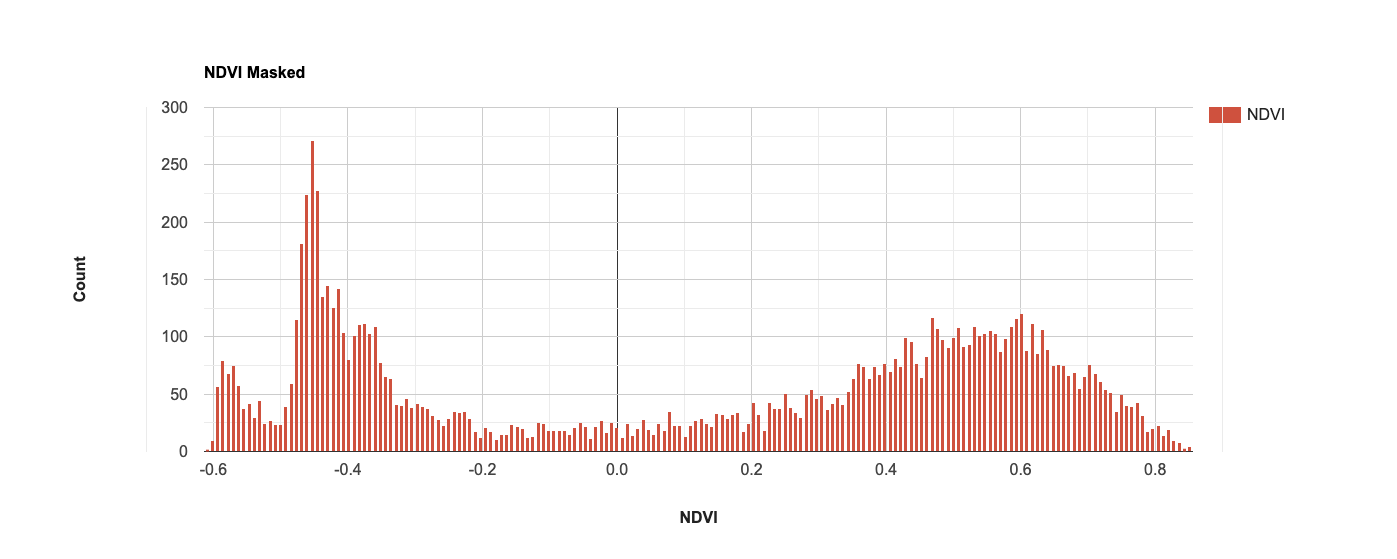
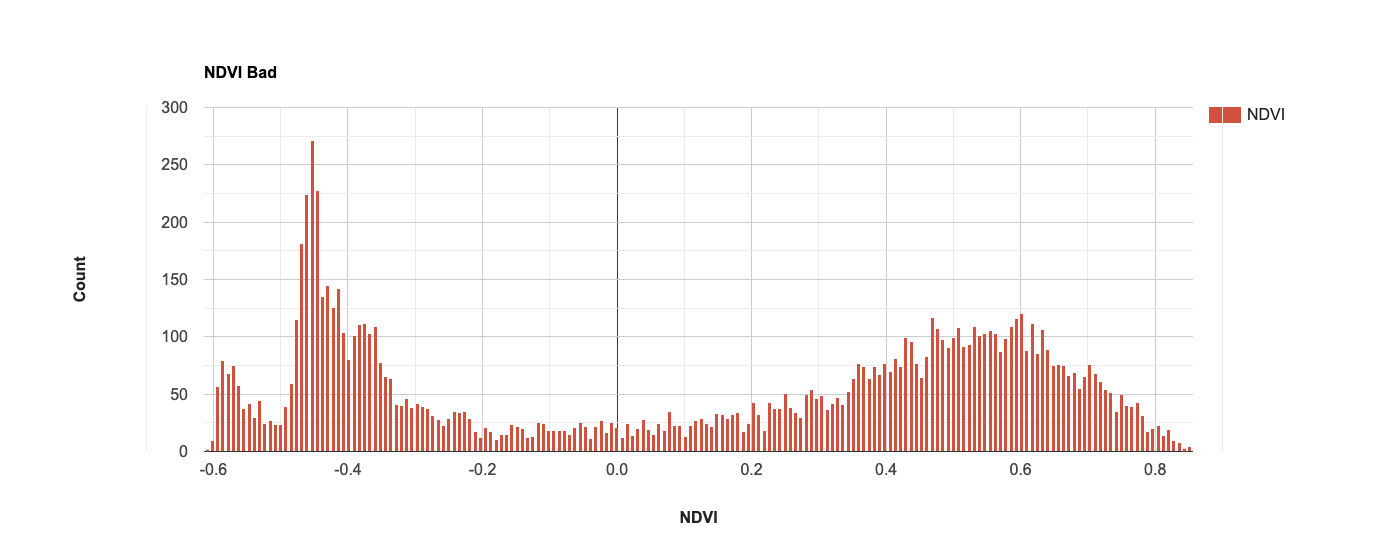
The issue you've run into is that you are trying to apply an image function to an imageCollection. The solution is to map the function to the image collection. However, I took the liberty of plotting a histogram of your "bad" NDVI data and I don't see any immediate issues with the values therein.

var landsat = ee.ImageCollection("LANDSAT/LC08/C02/T1_L2");
var aoi = 
    /* color: #d63000 */
    /* shown: false */
    ee.Geometry.Polygon(
        [[[-90.28893540845067, 30.185849313602084],
          [-90.48119615063817, 29.540364376709284],
          [-89.43200181470067, 29.37774455816459],
          [-89.21502183423192, 30.15260570786985]]]),
    landsat = ee.ImageCollection("LANDSAT/LC08/C01/T1_SR");

//Image reduction
//Image 3: August-November, 2020
var images = ee.ImageCollection(landsat
.filterBounds(aoi)
.filter(ee.Filter.calendarRange(2020, 2020, 'year')));
var growing = ee.ImageCollection(images
.filter(ee.Filter.calendarRange(8, 11, 'month'))
.sort('CLOUD_COVER_LAND')
.first()
);
var clipGrowing20 = growing.map(function(image){return image.clip(aoi)}) ;
print ('Growing Season 2020:', clipGrowing20);

var addNDVI = function(image) {
  var ndvi = image.normalizedDifference(["B5","B4"])
    .rename('NDVI');
  return image.addBands(ndvi);
};

var collectionNDVI20 = clipGrowing20.map(addNDVI);
print ('Not Masked NDVI 2020: ', collectionNDVI20);
Map.addLayer(collectionNDVI20, {bands:"NDVI"}, "collectionNDVI20");

var badNDVI = collectionNDVI20.select('NDVI');
print("badNDVI",badNDVI);
Map.addLayer(badNDVI, {}, "badNDVI");
// Flip mask parameters.    
var maskNDVI = function(image){
    var NDVI = image.select("NDVI");
    var t1 = image.updateMask(NDVI.lt(1));
    var t2 = t1.updateMask(NDVI.gt(-1));
    return(t2);
};
// Map mask to collection
var NDVImasked = collectionNDVI20.map(maskNDVI);
print("NDVImasked",NDVImasked);
Map.addLayer(NDVImasked, {}, "NDVImasked");
// Plot "Bad" data
var chart1 =
    ui.Chart.image.histogram({image: badNDVI.first(), region: aoi, scale: 900})
        .setSeriesNames(['NDVI'])
        .setOptions({
          title: 'NDVI Bad',
          hAxis: {
            title: 'NDVI',
            titleTextStyle: {italic: false, bold: true},
          },
          vAxis:
              {title: 'Count', titleTextStyle: {italic: false, bold: true}},
          colors: ['cf513e', '1d6b99', 'f0af07']
        });
print("Bad NDVI", chart1);
// Plot "masked" data
var chart2 =
    ui.Chart.image.histogram({image: NDVImasked.select("NDVI").first(), region: aoi, scale: 900})
        .setSeriesNames(['NDVI'])
        .setOptions({
          title: 'NDVI Masked',
          hAxis: {
            title: 'NDVI',
            titleTextStyle: {italic: false, bold: true},
          },
          vAxis:
              {title: 'Count', titleTextStyle: {italic: false, bold: true}},
          colors: ['cf513e', '1d6b99', 'f0af07']
        });
print("Masked NDVI", chart2);

Original data Masked data

3
  • Thank you so much for your answer. Odd that you don't have bad numbers with the badNDVI histogram. When I plot it I get values from -145 to 25. I think it has something to do with the Landsat OLI harmonization I applied to the image. I didn't include that in my code that I posted here because I didn't think it was relevant but I guess it was. I'm still not finding resolution with my code. Here is my code if this helps: code.earthengine.google.com/…
    – Alicia
    Jun 20, 2021 at 16:31
  • Ok, I see where your issue is probably arising. Your mask parameters are inverted, so the mask is leading to a totally blank dataset (you can't be both less than -1 and greater than +1). I updated my answer to reflect this, and plotted the result to show the data are the same. If you switched the mask to be greater than 0 and less than 1, you'd find that the margins apply in the histogram as well. Sounds like you need to take a look at your harmonization though. Jun 21, 2021 at 16:51
  • This worked perfectly. I found an error in my code where I wasn't mapping (or doing NDVI on the harmonized image correctly. Your code to map NDVI is now working without having to mask out any bad pixels. Your code also worked to mask out the bad pixels (if it were needed). Thank you!
    – Alicia
    Jun 22, 2021 at 19:15

Your Answer

By clicking “Post Your Answer”, you agree to our terms of service and acknowledge you have read our privacy policy.

Not the answer you're looking for? Browse other questions tagged or ask your own question.