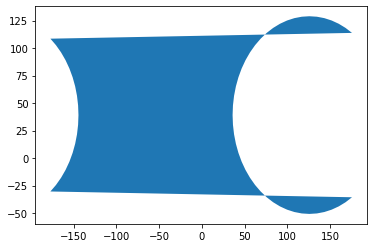
I'm trying to create a large buffer (10,000km) around a specific point using Geopandas but the resulting shape is incorrect. I've changed the crs of the geodataframe to a projected crs (epsg:4087, World Equidistant Cylindrical, meters) before calculating the buffer, but the result is still not right. Here's the code:
import pandas as pd
import numpy as np
import geopandas as gpd

# This is the point around which I want to generate the buffer
pyongyang = pd.DataFrame({'city': ['Pyongyang'], 'country': ["Democratic People's Republic of Korea"], 'longitude': [125.7552106631059], 'latitude': [39.038430756002995]})

# Create the GeoDataFrame
pyongyangGeo = gpd.GeoDataFrame(pyongyang, geometry=gpd.points_from_xy(pyongyang.longitude, pyongyang.latitude), crs='epsg:4326')

# Change the crs to a projected crs in meters
pyongyangGeo = pyongyangGeo.to_crs('epsg:4087')

# Calculate the buffer (10,000km)
maxReach = pyongyangGeo.buffer(10000000)

# Create GeoDataFrame with the buffer
maxReachGeo = gpd.GeoDataFrame(pyongyang, geometry=maxReach, crs='epsg:4087')

# Change the crs for the buffer to WGS 84 to visualize it
maxReachGeo = maxReachGeo.to_crs('epsg:4326')

# Plot it
maxReachGeo.plot()
And this is the resulting plot:
As you can see there, the buffer seems to wrap around itself and remove the overlapping portions.

