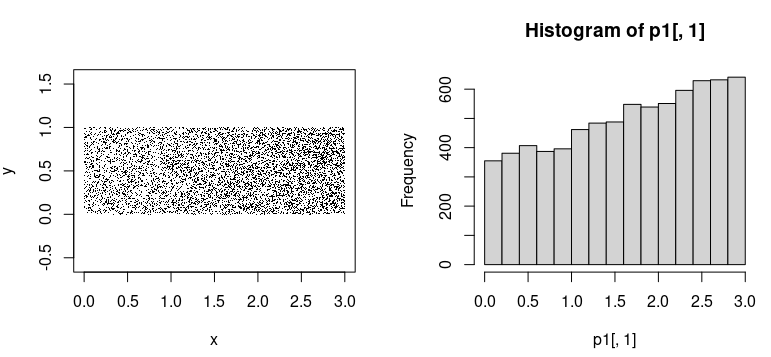
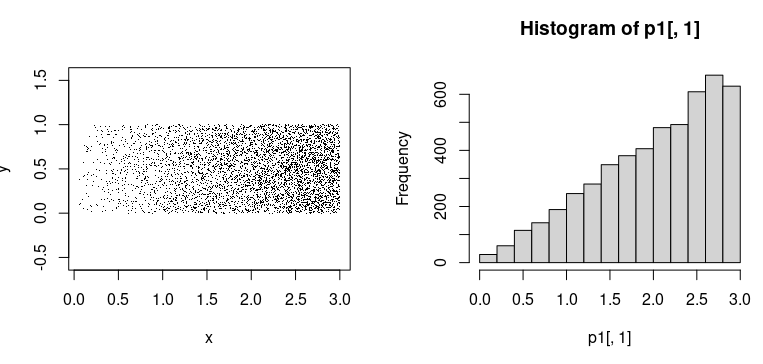
I have a spatialpolygondataframe that represents census tracts. I want to simulate different scenarios of population density or distribution to test a model. To do this, I want to generate random points within the census tracts to represent the population. However, I want to skew the location of the population density or distribution. For example, in scenario 1 the location of the highest population density is west and the location of high population density is east in scenario 2.
I found an answer to a similar question here however the point distribution is skewed based on population size. Thus, I can't use the solution for my simulation. I tried the mock code below based on the solution
library(raster)
library(sf)
library(dplyr)

nsplit = function(X,n){
  p = X/sum(X)
  diff(round(n*cumsum(c(0,p))))
}

nc <- read_sf(system.file("shape/nc.shp", package="sf")) %>%
  st_transform(32617)

sample_points <- st_sample(nc, size = 1000,
                           type = 'random', exact = TRUE) %>%
  # optional: Give the points an ID
  st_sf('ID' = seq(length(.)), 'geometry' = .) %>%
  # optional: Get underlying polygon attributes
  st_intersection(., nc)

plot(nc[0], reset = FALSE, axes = TRUE)
plot(sample_points['NAME'], pch = 19, cex = 0.5, add = TRUE)
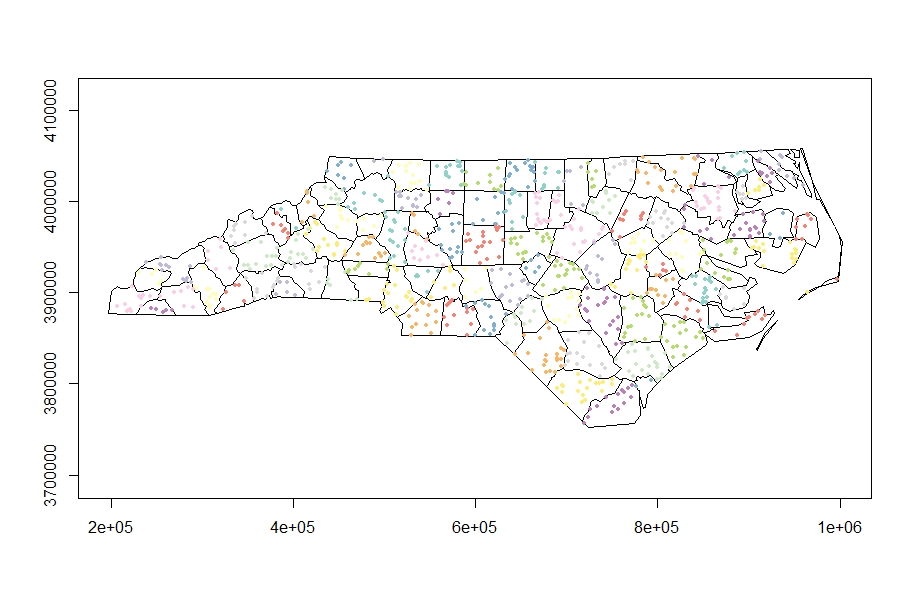
And this is the point distribution pattern I got
Using the NC polygons in the figure above, I would like to have a high number of points in the west for my first simulation scenario and east of NC for the second.


