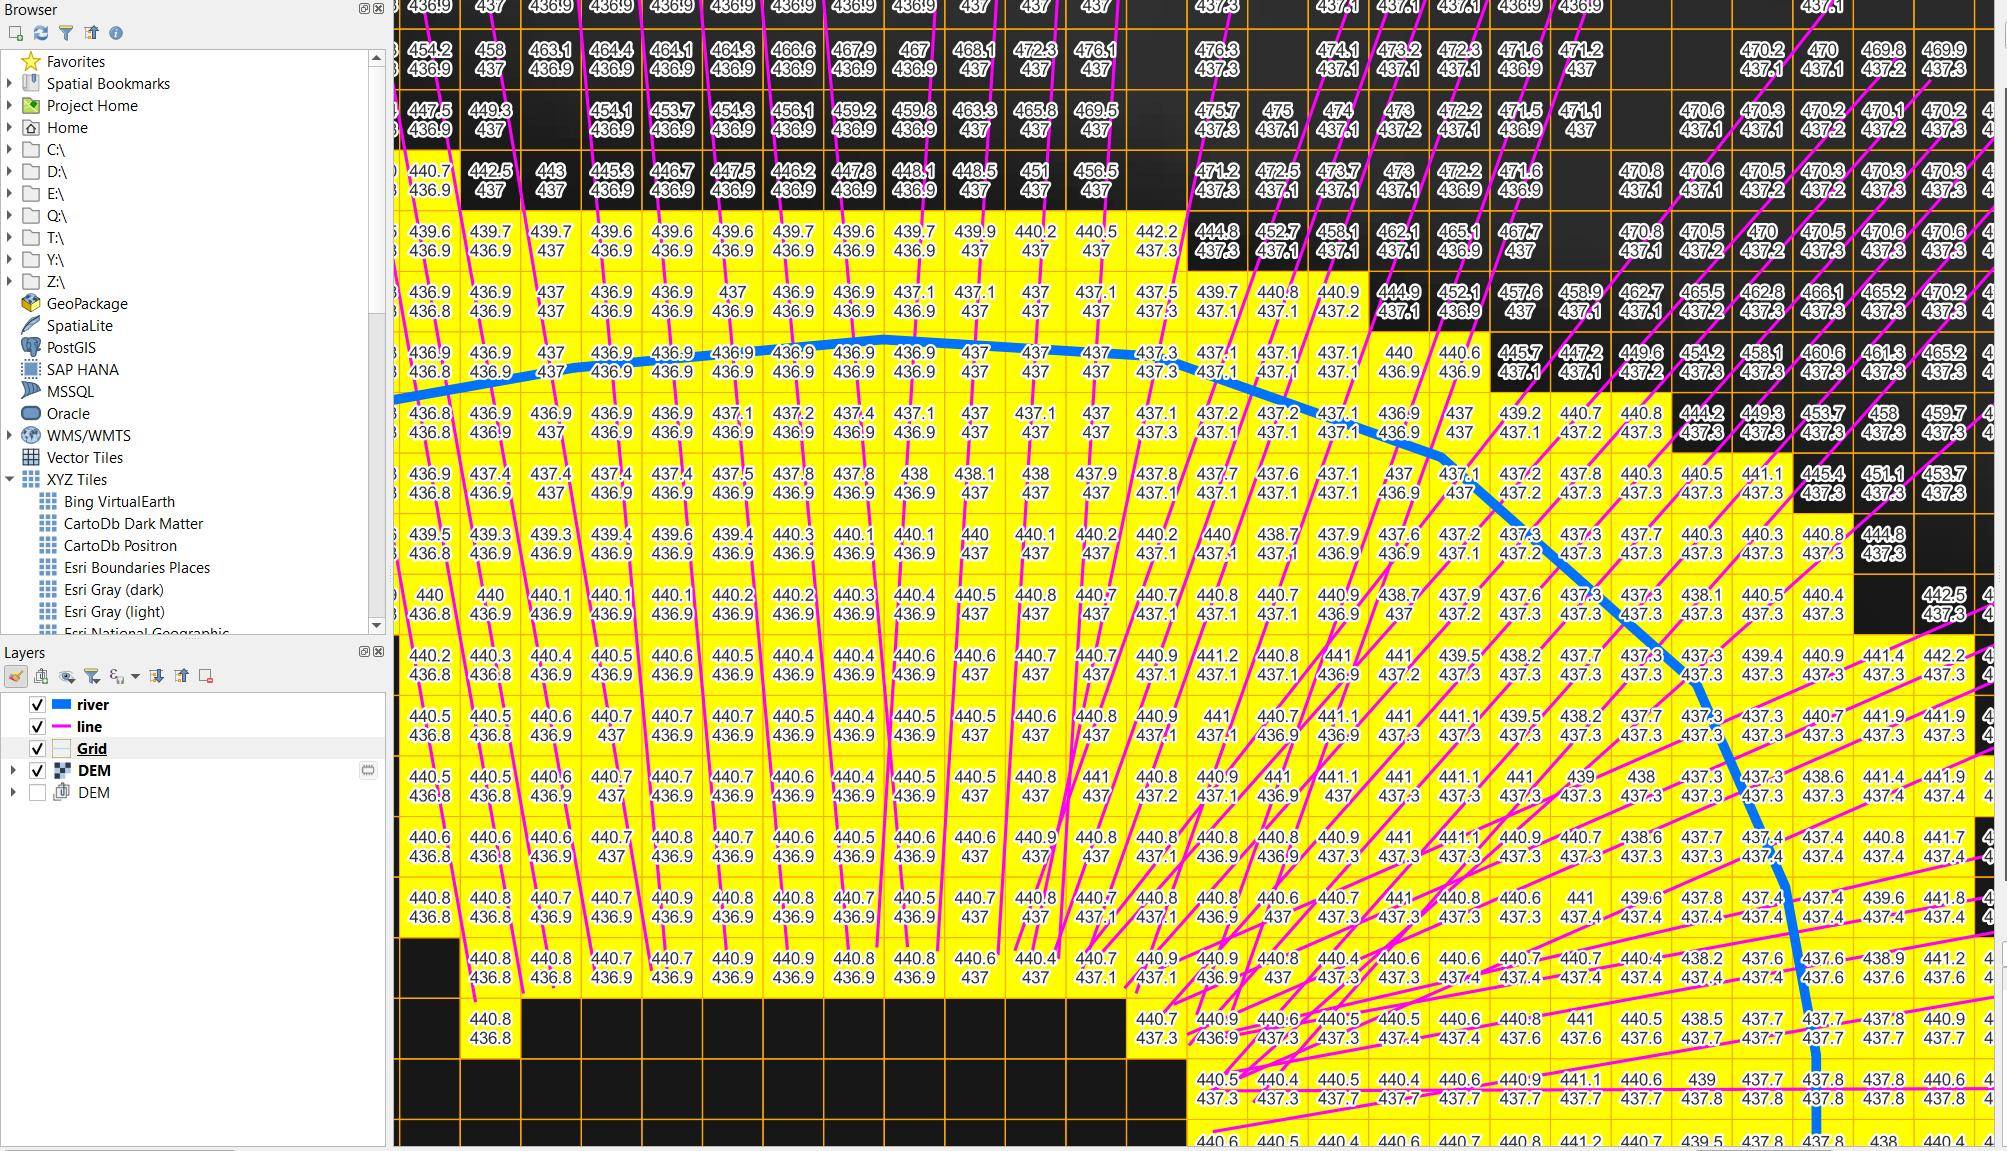
This solution provides a workflow to do exactly what you asked for. The workflow might not be the standard way how to calculate flooded areas, but since you asked for it, here is a way how to do it the way you asked for (as you might have reasons to do it this way). The advantage of this procedure, however, is that you can control the single steps and you can retrace in detail the output based on the date you have (see especially last screenshot). So it might have a didactic use as well.
The basic idea is to create a grid (polygon) layer and then create an attribute elevation for the elevation of each grid-cell, using an expression like raster_value( 'DEM', 1,centroid($geometry)).
Then create a layer called lines with perpendicular lines to the river layer: Get the intersection of each grid-cell with the river, thus creating small riverline sections inside of cells. Get the point on this lines closest to the grid's centroid and on this points create lines perpendicular to the river. Use this expression with Menu Processing / Toolbox / Geometry by expression:
with_variable (
    'river',
    intersection (
        geometry (get_feature_by_id ('river',11)),
        $geometry
    ),
    extend (
        make_line (
            centroid (@river),
            project (
                centroid (@river),
                100,
                radians(
                    90+degrees (
                        azimuth (
                            start_point (@river),
                            end_point (@river)
                        )
                    )
                )
            )
        ),
        100,
        0
    )
)
On the grid layer, check which cells intersect with these perpendicular lines and get the elevetion of the point where these lines intersect the river. As the lines were created based on grid layer cells that intersect the river, they contain the elevation at the river level. So use this expression to create a new attribute river_elev on the grid layer: each cell should contain the elevation of the line that intersects this cell. In case of more then one lines crossing the same cell, with array_min you get the lowest value, with array_max the highest one. Use this expression:
array_min(overlay_intersects('line',elevation))
Now create a new attribute difference that returns the difference of the elevation value of each cell and the elevation of the river: elevation - river_elev.
You can then select all cells that are within the range of 5 meters of the river elevation with this expression: difference <= 5.
Remark: depending on the size of your grid cells and the extent, calculation can take some time. Be sure to save permanently all layers + project before and create a spatial index.
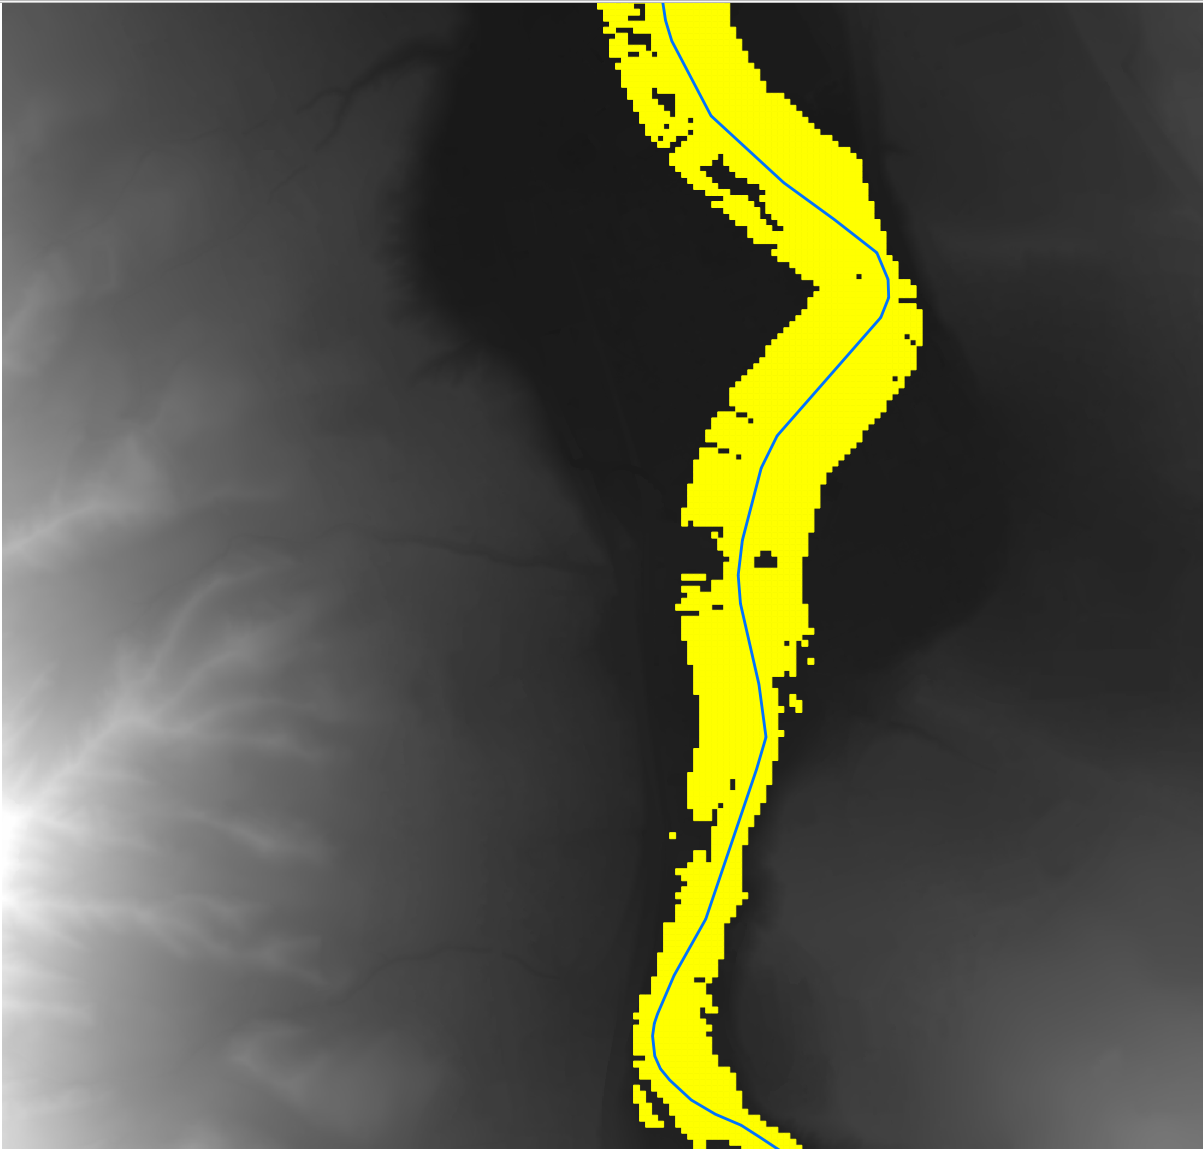
Result: area that fulfills the condition (max. 5 m above river level):

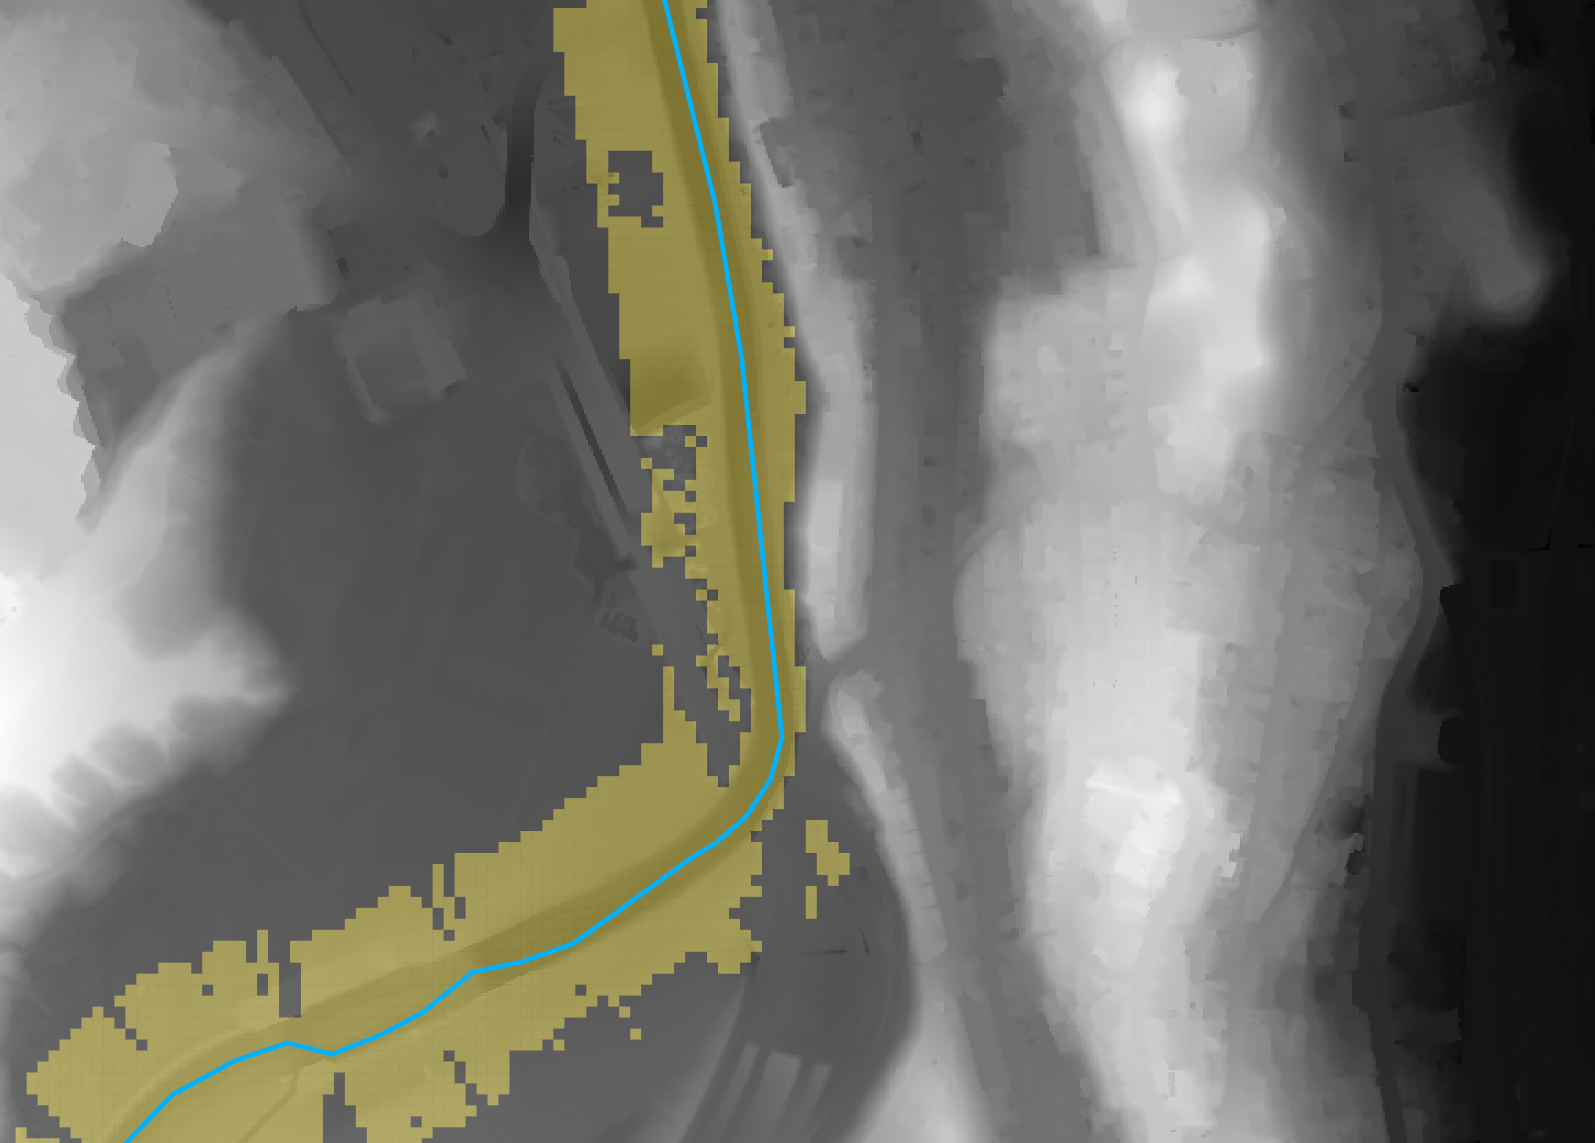
Affected area (detail):

Screenshot: river (blue line), grid cells (orange squares) and auxiliary lines perpendicular to the river (pink). Labels indicate: first line: elevation of the centroid of the cell in question, second line: elevation at river's level of the line crossing the cell (minimum value in case of more then one line). Highlighted in yellow cells where these two values have a difference of less then 5 meters. As you can see, one side of the rived (above) is much steeper, thus less cells are selected:


