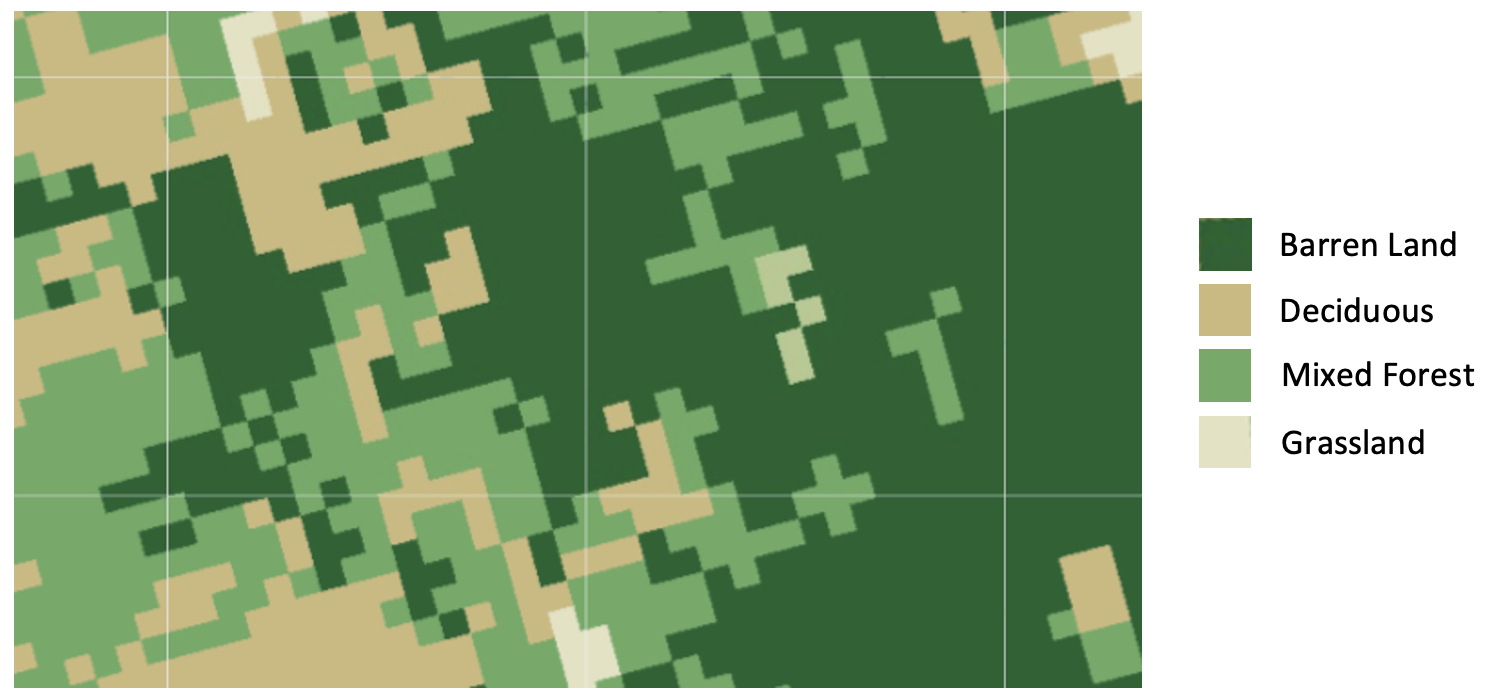
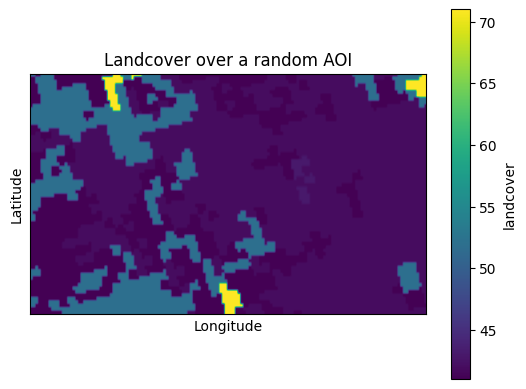
I am trying to plot GEE images as standalone figures (e.g., JPEG or PNG) for publications, however, I have not been able to find a standard method for doing that. For example, I have a landcover image and want to plot a bounding box of landcover pixels together with a legend that describes the label corresponding to the colors of each pixel. Is there a way to use something like Matplotlib in Python to create the figure? How do I do that? Here is a sample GEE image and how I would like the final product to look like:
import ee
ee.Initialize()

landcover = ee.ImageCollection('USGS/NLCD_RELEASES/2016_REL').filter(ee.Filter.eq('system:index', '2016')).first().select('landcover')

roi = ee.FeatureCollection(ee.Geometry.Polygon(
    [[[-121.214213, 39.102459],
      [-121.214213, 39.109467],
      [-121.199295, 39.109467],
      [-121.199295, 39.102459],
      [-121.214213, 39.102459]]]))


