4

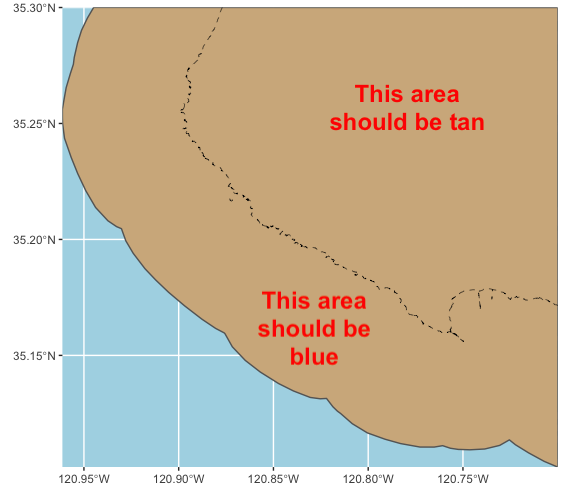
I want to create a polygon using a linestring within the sf universe. I am generating a map of a coastline and I want the area that is water to be blue and the area that is land to be tan. Because tigris::counties() data include county-designated territory that extends into the ocean, that format is undesirable. tigris also offers tigris::coastline(), which includes a detailed linestring representing the coast, however I can't apply fill values to the "right side" of a line. Therefore, I would like to "complete" the polygon that is defined as the coastline (object my_coast below) and the upper right corner of the bounding box.

## Import packages
library(tigris)
library(tidyverse)
library(sf)

## Define a bounding box
my_bbox = st_bbox(c(xmin = -121, xmax = -120.7, 
                    ymin = 35.1, ymax = 35.3),
                    crs = 4326)
## County boundaries extend into the ocean
my_counties = tigris::counties(state = "California") %>%
  st_transform(st_crs(my_bbox)) %>%
  st_crop(my_bbox)
## Coastline is the interesting part
my_coast = tigris::coastline() %>%
  st_transform(st_crs(my_bbox)) %>%
  st_crop(my_bbox)
## Plot data. Shown are the county "boundary" data as solid line 
## and coastline data as dashed line
ggplot() +
  geom_sf(data = my_counties,
          col = "grey40",
          fill = "tan") +
  geom_sf(data = my_coast,
          col = "black",
          size = 0.2,
          lty = 2) +
  coord_sf(expand = FALSE) +
  theme(panel.background = element_rect(fill = "lightblue"))

Annotated output image

1 Answer 1

4

I suggest using lwgeom::st_split() to split your counties object according to the coast linestring. It will return a geometry collection, so it needs to be piped to a sf::st_collection_extract("POLYGON") call.

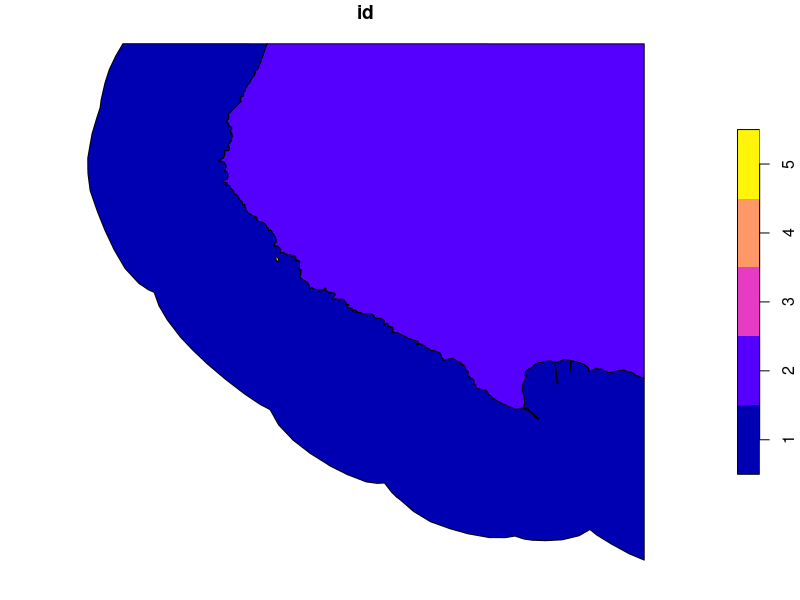
As there are several polygons - there are a few tiny islands in your area of interest - I have added a manual step to check which polygon is actual sea. Depending on your context this may be acceptable or not... In which case I would probably do a check via joining data to a point known to be in sea (assuming the sea area is continuous, which seems reasonable).

library(tidyverse)
library(sf)

## Choose region of interest
xmin = -121
xmax = -120.7
ymin = 35.1
ymax = 35.3

## Define a bounding box
my_bbox = st_bbox(c(xmin = xmin, xmax = xmax, 
                    ymin = ymin, ymax = ymax),
                  crs = 4326)
## County boundaries extend into the ocean
my_counties = tigris::counties(state = "California") %>%
  st_transform(st_crs(my_bbox)) %>%
  st_crop(my_bbox)
## Coastline is the interesting part
my_coast = tigris::coastline() %>%
  st_transform(st_crs(my_bbox)) 


# your code stops here :)
my_counties_new <- st_geometry(my_counties) %>% # take the geometry (only) of my counties
  lwgeom::st_split(st_geometry(my_coast)) %>% # split it by coast
  st_collection_extract("POLYGON") %>% 
  st_as_sf() %>% # make it from geometry to regular sf object
  mutate(id = 1:n())

plot(my_counties_new) # a visual check - which polygon is the sea?

enter image description here

# day 2: separate land from the water!

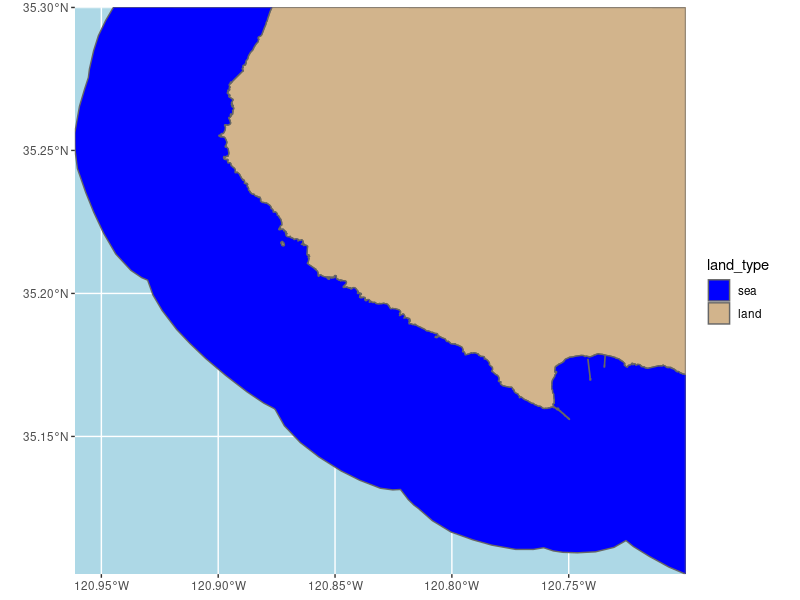
my_counties_new$land_type <- ifelse(my_counties_new$id == 1, "sea", "land")


## Plot data; after hte slight adjustment plotting of coastline is no longer necessary
ggplot() +
  geom_sf(data = my_counties_new,
          col = "grey40",
          aes(fill = land_type)) +
  coord_sf(expand = FALSE) +
  scale_fill_manual(values = c("sea" = "blue", "land" = "tan")) +
  theme(panel.background = element_rect(fill = "lightblue"))
enter image description here

Your Answer

By clicking “Post Your Answer”, you agree to our terms of service and acknowledge you have read our privacy policy.

Not the answer you're looking for? Browse other questions tagged or ask your own question.