2

Problem

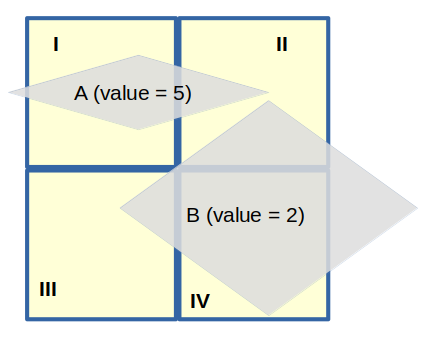
I want to rasterize polygon values and assign their weighted mean to raster cells. Weighting should be done based on the polygons' cell coverage.

Problem visualized

polgyon_raster

Calculation for grid cell II

  • Polygon A covers 10% of II.
  • Polygon B covers 25% of II.
  • Total polygon coverage of II is 35%.

So the value assigned for grid cell II will be:

(0.1/0.35)*5 + (0.25/0.35)*2 = 2.857

For grid cells I, III and IV it’s easy: They only get covered by one polygon and get their respective polgon's value assigned.

Reproducible Example

library("dplyr")
library("sf")
library("stars")
library("ggplot2")

nc_sf <- system.file("shape/nc.shp", package="sf") %>% 
  st_read() %>% 
  select(BIR74) %>% 
  rename(values = "BIR74")
nc_sf
# Simple feature collection with 100 features and 1 field
# Geometry type: MULTIPOLYGON
# Dimension:     XY
# Bounding box:  xmin: -84.32385 ymin: 33.88199 xmax: -75.45698 ymax: 36.58965
# Geodetic CRS:  NAD27
# First 10 features:
#   values                       geometry
# 1    1091 MULTIPOLYGON (((-81.47276 3...
# 2     487 MULTIPOLYGON (((-81.23989 3...
# 3    3188 MULTIPOLYGON (((-80.45634 3...
# 4     508 MULTIPOLYGON (((-76.00897 3...
# 5    1421 MULTIPOLYGON (((-77.21767 3...

nc_stars <- st_as_stars(
  st_bbox(nc_sf),
  nx = 20,
  ny = 10
  ) %>% 
  .[nc_sf] 
nc_stars
# stars object with 2 dimensions and 1 attribute
# attribute(s):
#   Min. 1st Qu. Median Mean 3rd Qu. Max. NA's
# values     0       0      0    0       0    0   91
# dimension(s):
#   from to   offset     delta refsys point values x/y
# x    1 20 -84.3239  0.443344  NAD27    NA   NULL [x]
# y    1 10  36.5896 -0.270766  NAD27    NA   NULL [y]
# Error in find.package(if (is.null(package)) loadedNamespaces() else package,  : 
#   there is no package called ‘extactextract’
# > nc_sf
# Simple feature collection with 100 features and 1 field
# Geometry type: MULTIPOLYGON
# Dimension:     XY
# Bounding box:  xmin: -84.32385 ymin: 33.88199 xmax: -75.45698 ymax: 36.58965
# Geodetic CRS:  NAD27
# First 10 features:
#    values                       geometry
# 1    1091 MULTIPOLYGON (((-81.47276 3...
# 2     487 MULTIPOLYGON (((-81.23989 3...
# 3    3188 MULTIPOLYGON (((-80.45634 3...
# 4     508 MULTIPOLYGON (((-76.00897 3...
# 5    1421 MULTIPOLYGON (((-77.21767 3...
# 6    1452 MULTIPOLYGON (((-76.74506 3...
# 7     286 MULTIPOLYGON (((-76.00897 3...
# 8     420 MULTIPOLYGON (((-76.56251 3...
# 9     968 MULTIPOLYGON (((-78.30876 3...
# 10   1612 MULTIPOLYGON (((-80.02567 3...
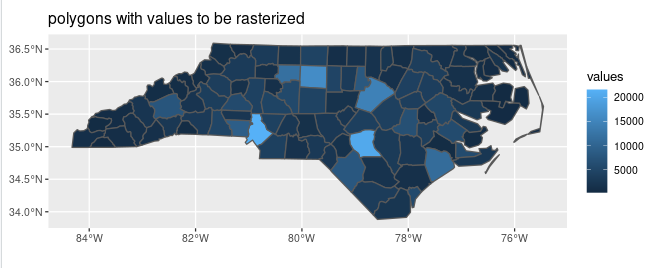
ggplot()+
  geom_sf(data = nc_sf, 
          aes(fill = values)) +
  ggtitle("polygons with values to be rasterized")

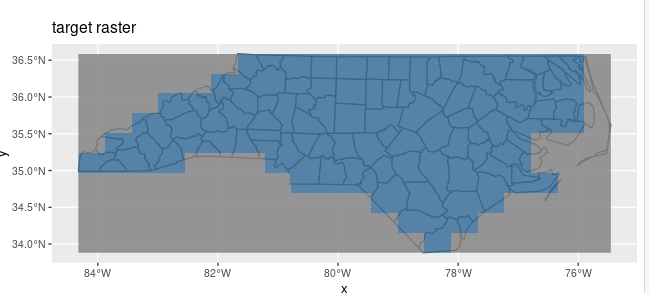
ggplot()+
  geom_sf(data = st_geometry(nc_sf)) +
  geom_stars(data = nc_stars, alpha = 0.8) +
  theme(legend.position = "none") +
  ggtitle("target raster")

polgons target_raster

Ideas on potential solutions

# Potentially helpful packages and functions
library("stars")
library("exactextractr")
library("terra")
library("raster")

stars::st_rasterize()
exactextractr::coverage_fraction()
terra::rasterize()
raster::rasterize()

I would prefer a stars::st_rasterize() based solution, but I'm happy to bring in other packages and functions such as exactextractr::coverage_fraction() or terra::rasterize() or the raster package. These seem to be the most promising to me.

My real life problem raster is pretty fine grained (around 690 000 cells), so I definitely need a solution that's not too computationally expensive. Hence, I'm afraid turning my raster into a polgyons to do all the calculations in sf is not really viable.

2
  • 1
    Where does that "there is no package called ‘extactextract’" message come from? It looks like a typo for exactextract (look carefully, its "extact-" at the start) and there's no mention of that in the code, so, is that in one of the packages?? Note you also need dplyr for the rename function.
    – Spacedman
    Commented Jun 3, 2022 at 10:31
  • fixed it @Spacedman, thx for pointing out the typo.
    – gosz
    Commented Jun 3, 2022 at 11:57

2 Answers 2

4

exactextractr gives you the information you need:

Get pixel's xy cordinates and coverage fraction per pixel by polygon:

library(exactextractr)
library(terra)

result <- exact_extract(rast(nc_stars), nc_sf, include_xy = T)

Add values by polygon and join all to a unique data.frame:

nc_values <- nc_sf %>% st_drop_geometry() %>% select(values)

for(i in seq_along(result)){
  result[[i]] <- cbind(result[[i]],values = nc_values[i,])
}

result <- do.call(rbind.data.frame,result)

This looks something like:

head(result)
# value         x        y coverage_fraction values
# 1    NA -81.88546 36.45427        0.07680427   1091
# 2     0 -81.44212 36.45427        0.76939684   1091
# 3     0 -81.44212 36.18350        0.10582609   1091
# 4     0 -81.44212 36.45427        0.13069978    487
# 5     0 -80.99877 36.45427        0.38078466    487
# 6     0 -80.99877 36.45427        0.30874124   3188

Then create new fields for getting the following:

(0.1/0.35)*5 + (0.25/0.35)*2 = 2.857
sum( (coverage_fraction/pixel_cov_fraction) * values)

Where pixel_cov_fraction is the sum of all polygons' coverage_fraction:

result %>% group_by(x, y) %>% 
  mutate(pixel_cov_fraction = sum(coverage_fraction),
         frac_value = values * coverage_fraction/pixel_cov_fraction) %>% 
  summarise(final_value = sum(frac_value, na.rm = T)) %>% 
  ungroup() -> for_raster

Looks like:

head(for_raster)
# # A tibble: 6 × 3
# x        y           final_value
# <dbl>    <dbl>       <dbl>
# 1 -84.1  35.1        972.
# 2 -84.1  35.4        514.
# 3 -84.1  35.6        675 
# 4 -83.7  35.1        621.
# 5 -83.7  35.4        588.
# 6 -83.7  35.6        675 

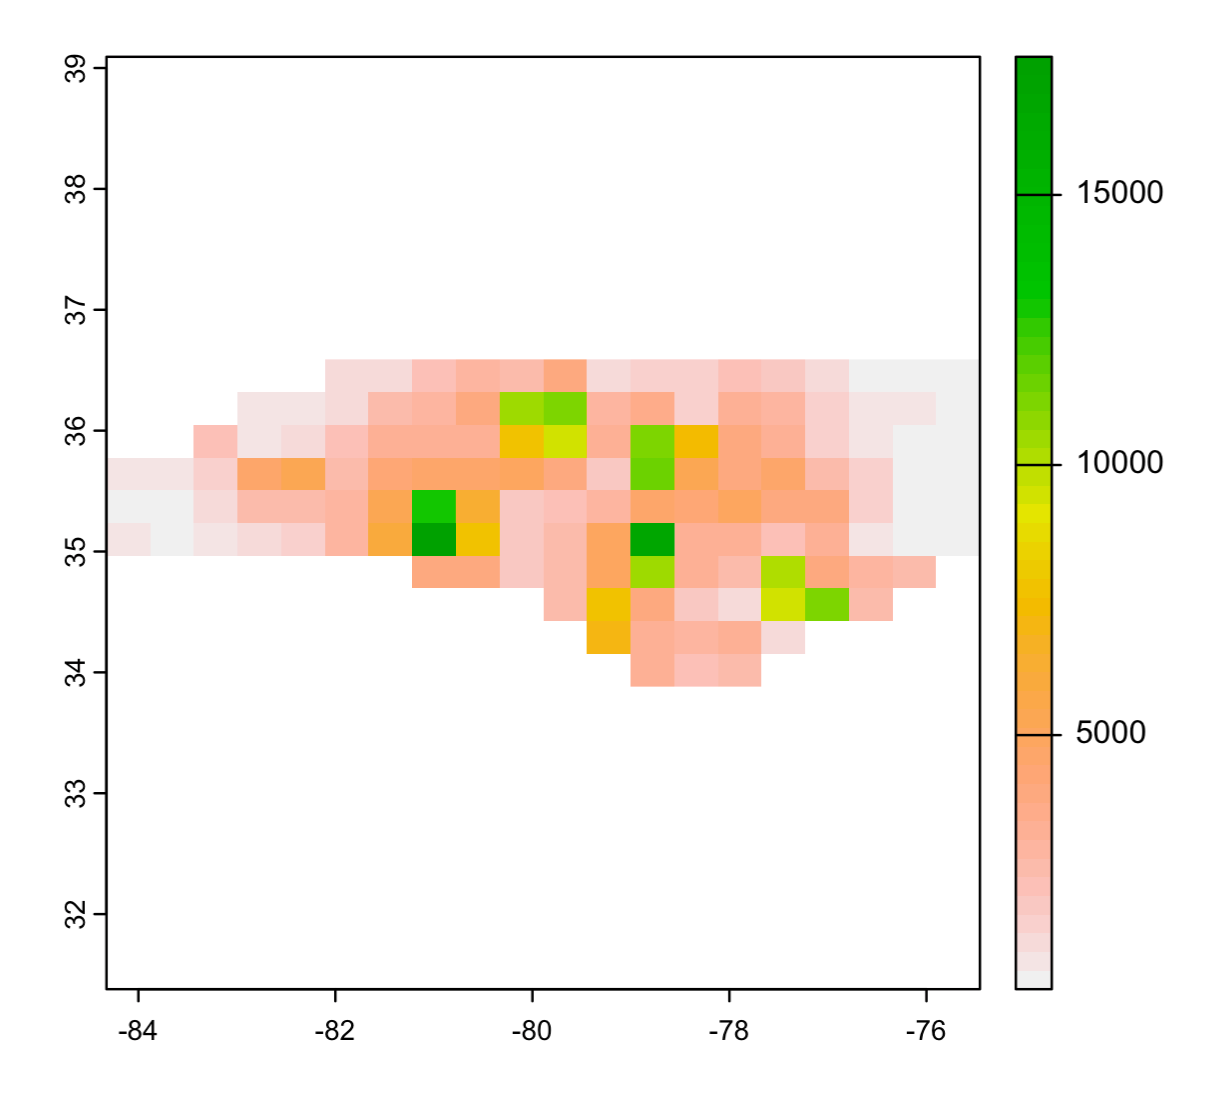
Then, rasterize results:

coords <- as.matrix(for_raster[,c('x','y')])

r <- rasterize(x = coords, y = rast(nc_stars),
               values = for_raster$final_value)

plot(r)

enter image description here

2
  • You can remove the "Add values by polygon" step with the include_cols argument to exact_extract
    – dbaston
    Commented Jun 3, 2022 at 18:14
  • @dbaston yes, I have used that argument many times. For some reason, include_cols failed with the example given: In format.data.frame(if (omit) x[seq_len(n0), , drop = FALSE] else x, ... : corrupt data frame: columns will be truncated or padded with NAs
    – aldo_tapia
    Commented Jun 3, 2022 at 18:25
2

Here is a more classic variation on Aldo's approach

Eexample data

library(terra)
nc <- vect(system.file("shape/nc.shp", package="sf"))
r <- rast(nc, ncol=20, nrow=10, crs=crs(nc))

Solution (using extract, but you can use exactextractr for better performance)

r <- init(r, NA)
e <- extract(r, nc, exact=TRUE, cells=TRUE) 
e$value <- nc$BIR74[e$ID] * e$fraction
a <- aggregate(e[, c("value", "fraction")], e[,"cell", drop=FALSE], sum)
r[a$cell] <- a$value / a$fraction

r
#class       : SpatRaster 
#dimensions  : 10, 20, 1  (nrow, ncol, nlyr)
#resolution  : 0.4433437, 0.2707657  (x, y)
#extent      : -84.32385, -75.45698, 33.88199, 36.58965  (xmin, xmax, ymin, ymax)
#coord. ref. : lon/lat NAD27 (EPSG:4267) 
#source      : memory 
#name        :    lyr.1 
#min value   : 296.3705 
#max value   : 17557.43 
 
1
  • This is great - thank you Robert! I had no idea this would require so few lines of code...
    – gosz
    Commented Jun 8, 2022 at 16:50

Your Answer

By clicking “Post Your Answer”, you agree to our terms of service and acknowledge you have read our privacy policy.

Not the answer you're looking for? Browse other questions tagged or ask your own question.