For this work Data are obtained from:- For Raster:-https://download.hermes.com.np/land-cover-map-of-nepal-2010/. For Vector :-https://cellapp.co/download-nepals-new-map-vector-image/. Rupandehi District was then selected and exported as a part of this work (named here as RupandehiLocalPlace).
Then, I clipped a raster file based on vector shapefile. The code I used as shown:-
library(sf)
library(rgdal)
library(raster)
setwd("C:/Users/lenovo/Desktop/EM")
LCN<-raster("np_lc_2010_v2f.tif")
RLU<-shapefile("RupandehiLocalPlace")
proj4string(RLU)
proj4string(LCN)
plot(LCN)
plot(RLU)
proj4string(LCN)<-CRS("+proj=utm +zone=44 +datum=WGS84 +units=m
+no_defs")
raster::projection(LCN)
LCN<-crop(LCN,RLU)
plot(LCN,main="Forest Area in 2019")
plot(LCN,
main="Forest Area in 2019",
axes=TRUE)
plot(RLU,add= TRUE)
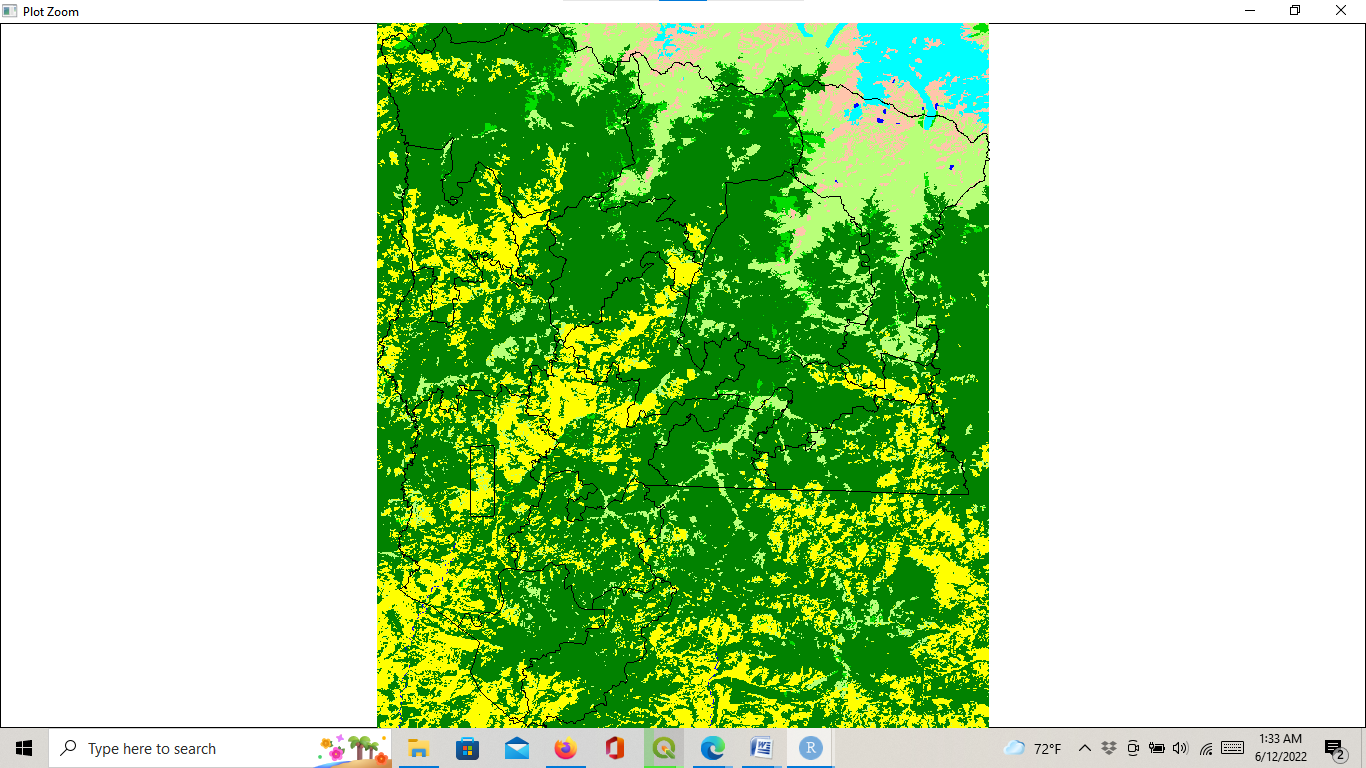
The result obtained is shown below:-

But, I don't have an idea of masking data.
Could someone let me know how to mask these data (raster based on vector)?
Also, I couldn't see spatial scale in either of direction.
How can this be solved?

