I am a Google Earth Engine beginning level user and I am trying to detect NDWI anomalies using Sentinel-2 & Landsat Harmonized data and this formula
I have watched and read some tutorials and this code seems to be "semi-working" except for the fact the NDWI Anomaly layer appears to be a plain grey image. I am struggling to understand what my mistakes are here. My area of interest here is a geometry polygon I drew myself which is the administrative border of the city of Berlin, so it is not included in the code as it is way too big
var V_display = {bands: ['B4', 'B3', 'B2'], min: 0, max: 3000};
var ndwi_palette = ['red','white', 'blue'] ;
function addndwi (input) {
  var ndwi = input.normalizedDifference(['B8', 'B11']).rename('ndwi');
  return input.addBands(ndwi);
}

// 2017 ndwi - REF
//
// 2018.06 ndwi - W1
//
// 2017 Referrence period  NDWI (June - September)
var REF = ee.ImageCollection("COPERNICUS/S2_SR_HARMONIZED")
  .filterBounds(geometry)
  .filterDate('2017-06-01', '2017-09-30')
  .filterMetadata('CLOUDY_PIXEL_PERCENTAGE', 'less_than', 40)
  .map(addndwi);
print(REF);
var REF_m = REF.median().clip(geometry);
Map.addLayer(REF_m, V_display, "Referrence 2017 median",false);
var ndwi_2017_REF = REF.select('ndwi').median().clip(geometry);
Map.addLayer(ndwi_2017_REF, {min: -1, max: 1, palette: ndwi_palette}, 'NDWI Ref Year 2017');

// Calculating the Standard deviation for the reference period
var REF_SD = REF.reduce(ee.Reducer.stdDev()).clip(geometry);
print (REF_SD);
var W_display = {bands: ['B4_stdDev', 'B3_stdDev', 'B2_stdDev'], min: -10, max: 3000};
Map.addLayer(REF_SD, W_display, "Referrence 2017 Standard Deviation",false);


// 2018 June NDWI
var W1 = ee.ImageCollection("COPERNICUS/S2_SR_HARMONIZED")
  .filterBounds(geometry)
  .filterDate('2018-06-01', '2018-06-30')
  .filterMetadata('CLOUDY_PIXEL_PERCENTAGE', 'less_than', 20)
  .map(addndwi);
print(W1);
var W1_m = W1.median().clip(geometry);
Map.addLayer(W1_m, V_display, "June 2018 median",false);
var ndwi_2018_06 = W1.select('ndwi').median().clip(geometry);
Map.addLayer(ndwi_2018_06, {min: -1, max: 1, palette: ndwi_palette}, 'NDWI June 2018');
Map.centerObject(geometry);

// Calculating the NDWI Anomalies for June 2018
var dif1 = ndwi_2018_06.subtract(ndwi_2017_REF);
var Andwi_2018_06 = dif1.divide(REF_SD);
print(Andwi_2018_06);
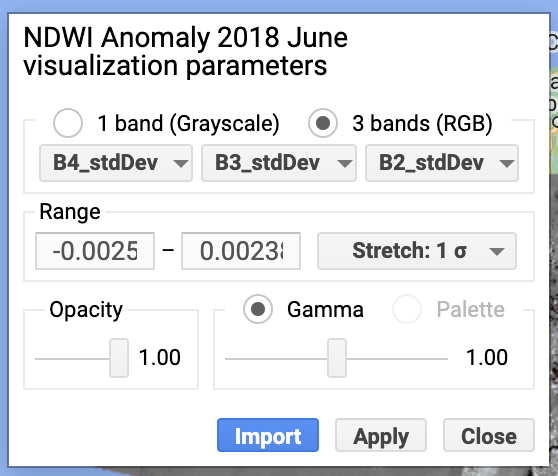
Map.addLayer(Andwi_2018_06,
             {bands: ['B4_stdDev', 'B3_stdDev', 'B2_stdDev'], min: -32, max: 32}, 'NDWI Anomaly 2018 June');


