I have been working on a lidar processing workflow using SAGA-GIS. I determined my workflow on a single tile in the SAGA GUI and now I need to batch the operations on 100 more tiles. I wrote a batch file to call the SAGA Command Line to run all the las files in a folder.
I noticed, though, that the out DSM created by the command line process looks much more blurred and interpolated than the DSM I created in the GUI for the same tile. Then, I started to investigate, so I started running each individual process of my workflow in the GUI and in the command line with the same data.
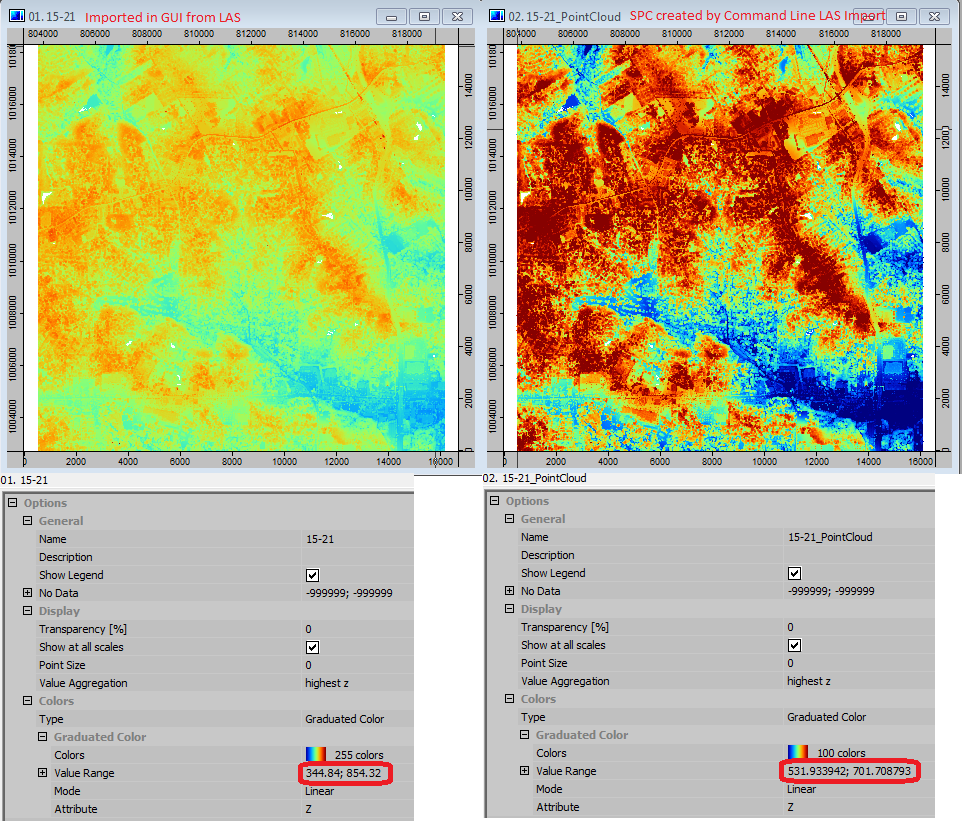
The very first step is to import the LAS file. In the GUI, this doesn't save to a .spc file, it just seems to do it in memory. With the command line, it will save a .spc file from the LAS file. These two files are different:

The picture in the upper left is the point cloud created when I imported the LAS file in the SAGA GUI. Notice the values circled in the lower left image. Those are the Min/Max values of the upper left point cloud. The picture in the upper right is the SPC file that was created when running the Import LAS module via the command line. Notice the Min/Max values circled in the bottom right.
As far as I can tell, all the parameters I used were identical. In fact, I ran the GUI version first and then right-clicked on the module to create the batch file with all the same parameters.
Can anyone help me with this? The DSM's created by the batch file are not nearly as clear as the one created by the GUI because they require more interpolation and cannot be used for identifying tree canopy.
