0

edit: setting mode = "wb" to download the file is crucial for correct reading using solution by Spacedman

I'm trying to get raster data on depth from EMODnet into R to analyse, using the WCS service.

Following the examples here, I've constructed the following file called "request2.xml":

<?xml version="1.0" encoding="UTF-8"?>
<wcs:GetCoverage xmlns:wcs="http://www.opengis.net/wcs/1.1.1" xmlns:gml="http://www.opengis.net/gml"
  xmlns:ogc="http://www.opengis.net/ogc" xmlns:ows="http://www.opengis.net/ows/1.1"
  xmlns:xsi="http://www.w3.org/2001/XMLSchema-instance"
  version="1.1.1" service="WCS"
  xsi:schemaLocation="http://www.opengis.net/wcs/1.1.1 http://schemas.opengis.net/wcs/1.1.1/wcsAll.xsd">
   <ows:Identifier>emodnet:mean</ows:Identifier>
   <wcs:DomainSubset>
      <ows:BoundingBox crs="urn:ogc:def:crs:EPSG::4326">
         <ows:LowerCorner>43.48729 -2.5319802324929</ows:LowerCorner>
         <ows:UpperCorner>44.016457 -1.634064</ows:UpperCorner>
      </ows:BoundingBox>
   </wcs:DomainSubset>
   <wcs:Output store="true" format="image/tiff">
      <wcs:GridCRS>
         <wcs:GridBaseCRS>urn:ogc:def:crs:EPSG::4326</wcs:GridBaseCRS>
         <wcs:GridType>urn:ogc:def:method:WCS:1.1:2dSimpleGrid</wcs:GridType>
         <wcs:GridOffsets>0.0020881772848672093 -0.0020833346456692954</wcs:GridOffsets>
         <wcs:GridCS>urn:ogc:def:cs:OGC:0.0:Grid2dSquareCS</wcs:GridCS>
      </wcs:GridCRS>
   </wcs:Output>
</wcs:GetCoverage>

I try to process this using the following code in R:

library(RCurl)
library(XML)
library(raster)
xml <- paste(readLines("Request2.xml"),collapse = "\n")

myheader=c(Connection="close", 
            'Content-Type' = "application/xml",
             'Content-length'=nchar(xml))

response <- getURL(url = "http://ows.emodnet-bathymetry.eu/wcs?",
                   postfields = xml,
                   httpheader = myheader)

xmlresp <- xmlTreeParse(response, asText = TRUE,useInternalNodes=TRUE)
link <- xmlGetAttr(getNodeSet(xmlresp,'//wcs:Coverages/wcs:Coverage/ows:Reference' )[[1]],
           "href")
download.file(link, destfile = "test.tiff",
              mode = "wb")

ras <- terra::rast("test.tiff")

Everything works, until I try to extract the raster information. I keep getting a message that the data is rotated, and I should use rectify(). But doing so loses all information. Furthermore, upon inspection it seems that the information isn't read correctly:

> ras <- terra::rast("test.tiff")
Warning: [rast] the data in this file are rotated. Use 'rectify' to fix that> 
> ras
class       : SpatRaster 
dimensions  : 431, 253, 1  (nrow, ncol, nlyr)
resolution  : 0, 0  (x, y)
extent      : -1.634064, -1.634064, 43.48729, 43.48729  (xmin, xmax, ymin, ymax)
coord. ref. : lon/lat WGS 84 (EPSG:4326) 
source      : test.tiff 
name        : test 

I've looked at drivers for gdal and feel a bit like I'm drowning. Anywone who can point out what I'm doing wrong?

3
  • coord. ref. : lon/lat WGS 84 (EPSG:4326) is wrong. epsg:4326 is lat/long
    – nmtoken
    Commented Dec 12, 2022 at 16:58
  • 1
    I think the terra package makes a real dog's breakfast from this file, getting the extent wrong and being unable to rectify it. I'd consider a bug report to terra (ignore raster package's problems, its less priority for the developer...)
    – Spacedman
    Commented Dec 12, 2022 at 18:27
  • @nmtoken woopsie... Don't know how to fix that though. I'm a novice when it comes to geostat
    – Joris Meys
    Commented Dec 13, 2022 at 8:40

1 Answer 1

2

stars seems to be better at handling rotated, sheared, and general curvilinear grids. In this case the TIFF seems to have a slight shear angle to it:

> rs = read_stars("test.tiff")
> rs
stars object with 2 dimensions and 1 attribute
attribute(s):
              Min. 1st Qu.    Median      Mean   3rd Qu.  Max.
test.tiff  -2221.4  -867.4 -416.7852 -534.6465 -127.5312 -42.5
dimension(s):
  from  to   offset delta refsys point values x/y
x    1 253 -1.63406     0 WGS 84 FALSE   NULL [x]
y    1 431  43.4873     0 WGS 84 FALSE   NULL [y]
sheared raster with parameters: -0.00208333232596961 0.00209156916996049 

Plotting is slow because it has to compute all the shears for every pixel. Ugh.

You can warp to a rectilinear grid:

Define a new grid based on the bbox of the raster:

> ng = st_as_stars(st_bbox(rs))
> ng
stars object with 2 dimensions and 1 attribute
attribute(s):
        Min. 1st Qu. Median Mean 3rd Qu. Max.
values     0       0      0    0       0    0
dimension(s):
  from  to   offset       delta refsys point values x/y
x    1 332 -2.53198  0.00270786 WGS 84    NA   NULL [x]
y    1 196  44.0165 -0.00270786 WGS 84    NA   NULL [y]

You can probably adjust numbers of rows and columns. And then warp:

> rss = st_warp(rs, ng)
> rss
stars object with 2 dimensions and 1 attribute
attribute(s):
              Min. 1st Qu.    Median      Mean   3rd Qu.  Max. NA's
test.tiff  -2220.2  -867.4 -417.8477 -535.0106 -127.4912 -42.5  332
dimension(s):
  from  to   offset       delta refsys point values x/y
x    1 332 -2.53198  0.00270786 WGS 84    NA   NULL [x]
y    1 196  44.0165 -0.00270786 WGS 84    NA   NULL [y]

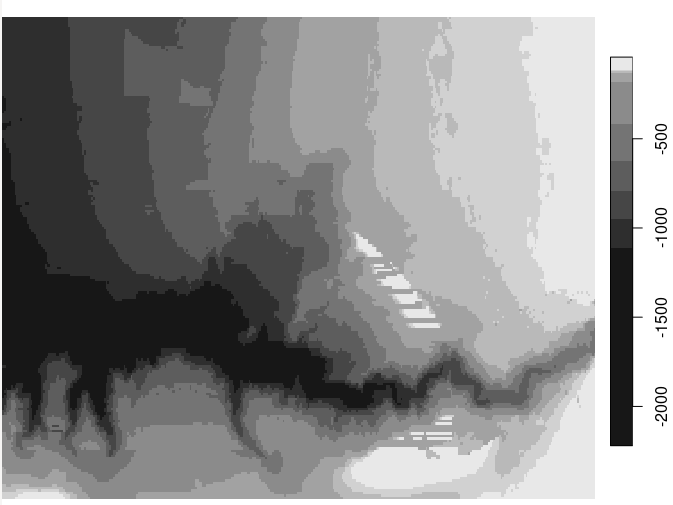
plot(rss) then gives you:

enter image description here

If you need this in raster/terra then conversions should be simple. Note this warping is a lossy process. I think the shearing here is possibly minor enough that you could ignore it in some way but not sure how to do that...

4
  • Thx for the effort! I got closer, but I still get a very large deviation from your output. The attributes I get range from -3.376278e+38 to 3.232712e+38 , quite a difference with the -2220 to -42.5 you get. Any idea what might be the difference in my setup?
    – Joris Meys
    Commented Dec 13, 2022 at 8:50
  • 1
    Version of underlying GDAL library? What does library(stars) say about the things it links to? What version of stars? I have: stars 0.5-3 and "Linking to GEOS 3.8.0, GDAL 3.0.4, PROJ 6.3.1; sf_use_s2() is TRUE"
    – Spacedman
    Commented Dec 13, 2022 at 11:37
  • I have version 0.6.0, and "linking to GEOS 3.9.3, GDAL 3.5.2, PROJ 8.2.1; sf_use_s2() is TRUE". So that might explain the differenc in outcome. But even in the plot you show, there's some artifacts that shouldn't be there. Damn, geostats is hard!
    – Joris Meys
    Commented Dec 13, 2022 at 12:35
  • I can hit myself. When downloading the file, setting mode = "wb" helps LOL. Sorry for wasting your time and thx for the tip about rast, really helps!
    – Joris Meys
    Commented Dec 13, 2022 at 12:55

Your Answer

By clicking “Post Your Answer”, you agree to our terms of service and acknowledge you have read our privacy policy.

Not the answer you're looking for? Browse other questions tagged or ask your own question.