3

Context

I am working on a R package that allows users to make custom star maps which displays the night sky for a given location and time. The package aims to replicate the product offered by MapsForMoments.

The Question

TL;DR: How do you calculate the rotation of the celestial sphere for a given location and date?

The code I have is:

library(tidyverse)
library(tidygeocoder)
library(sf)
library(s2)
library(grid)
library(lubridate)
library(withr)

plot_starmap <- function(location,
                         date = today(),
                         style = c('black', 'green'),
                         line1_text = location,
                         line2_text = format(as.Date(date), "%B %d, %Y"),
                         line3_text=TRUE){

  # Using match.arg to avoid spelling errors with the argument specification
  style <- match.arg(style)
  # Cleaning up date arg
  date<- as.Date(date)

  # Formatted date
  dt<- lubridate::ymd(date)


  # Extract relevant latitude and longitude.

  # Latitude is dependent on location
  suppressMessages(
    capture.output(
      gocodeData <-  tibble(singlelineaddress = location) %>%
                     geocode(address=singlelineaddress,method = 'arcgis')
    )
  )

  lat <- gocodeData %>% .[["lat"]]
  # longitude for line3_text
  lon_map <-gocodeData %>%  .[["long"]]

  if(line3_text==TRUE){
    line3_text <- paste0(abs(round(lat,4)), "° ", ifelse(lat > 0, "N", "S"), ", ",
                         abs(round(lon_map,4)), "° ", ifelse(lon_map > 0, "E", "W")
    )
  }
  ref_date <- paste0(year(dt),"01","01",sep="-") %>% ydm()
  # Resulting longitude
  lon <- (-as.numeric(difftime(ref_date,dt, units="days"))/365)*360 %>% round(4)

  # The CRS

  projString <- paste0("+proj=laea +x_0=0 +y_0=0 +lon_0=",lon, " +lat_0=", lat)


  # Data Transformation
  flip <- matrix(c(-1, 0, 0, 1), 2, 2)

  hemisphere_1 <- s2::s2_buffer_cells(
    s2::as_s2_geography(paste0("POINT(", lon, " ", lat, ")")),
    distance = 1e7,
    max_cells = 5000)

  hemisphere_2 <- st_sfc(st_point(c(lon, lat)), crs = 4326) %>%
    st_buffer(dist = 1e7) %>%
    st_transform(crs = projString)

  # Reading Data
  invisible(
    capture.output(
      constellation_lines_sf <- invisible(st_read(system.file("data", "constellations.lines.json", package = "starBliss"), stringsAsFactors = FALSE)) %>%
        st_wrap_dateline(options = c("WRAPDATELINE=YES", "DATELINEOFFSET=360")) %>%
        # Use s2 for the cut
        st_as_s2() %>%
        s2::s2_intersection(hemisphere_1) %>%
        # Back to sf
        st_as_sf() %>%
        st_transform(crs = projString) %>%
        filter(!is.na(st_is_valid(.))) %>%
        mutate(geometry = geometry * flip) %>%
        # Filter if empty, since the cut can produce empty geometries
        filter(!st_is_empty(.))
    )
  )


  st_crs(constellation_lines_sf) <- projString

  # Reading Data
  withr::with_options(list(warn=-1),
  invisible(
    capture.output(
      stars_sf <- st_read(system.file("data", "stars.6.json", package = "starBliss"),stringsAsFactors = FALSE) %>%
        st_transform(crs = projString) %>%
        st_intersection(hemisphere_2) %>%
        mutate(geometry = geometry * flip)
    )
  )
)
  st_crs(stars_sf) <- projString


  # Setting parameters to update map
  if(style=="black"){
    fillVal <-  '#191d29'
    colVal <- '#191d29'
    colorVal <- "white"
    majorGridCol <-"grey35"
    minorGridCol <- "grey20"
  }
  if(style == "green"){
    fillVal <-  '#164B58'
    colVal <- '#164B58'
    colorVal <- "white"
    majorGridCol <-"#FEFEFE"
    minorGridCol <- "#FEFEFE"
  }
  # Creating the frame
  mask <- polygonGrob(x = c(1, 1, 0, 0, 1, 1,
                            0.5 + 0.46 * cos(seq(0, 2 *pi, len = 100))),
                      y =  c(0.5, 0, 0, 1, 1, 0.5,
                             0.5 + 0.46 * sin(seq(0, 2*pi, len = 100))),
                      gp = gpar(fill = fillVal, col = colVal))

  p <- ggplot() +
    geom_sf(data = stars_sf, aes(size = -exp(mag), alpha = -exp(mag)),
            color = colorVal)+
    geom_sf(data = constellation_lines_sf, color = colorVal,
            size = 0.5) +
    annotation_custom(circleGrob(r = 0.46,
                                 gp = gpar(col = colorVal, lwd = 10, fill = NA))) +
    scale_y_continuous(breaks = seq(0, 90, 15)) +
    scale_size_continuous(range = c(0, 2)) +
    annotation_custom(mask) +
    labs(caption = paste0(line1_text,'\n',line2_text,'\n',line3_text)) +
    theme_void() +
    theme(legend.position = "none",
          panel.grid.major = element_line(color = majorGridCol, linewidth = 1),
          panel.grid.minor = element_line(color = minorGridCol, linewidth = 1),
          panel.border = element_blank(),
          plot.background = element_rect(fill = fillVal, color = colVal),
          plot.margin = margin(20, 20, 20, 20),
          plot.caption = element_text(color = colorVal, hjust = 0.5,
                                      face = 2, size = 20,
                                      margin = margin(150, 20, 20, 20),
          ))


  return(p)
}

This code seems to work well for North America, however recently someone pointed out that it doesn't work for Riyadh, Saudi Arabia.

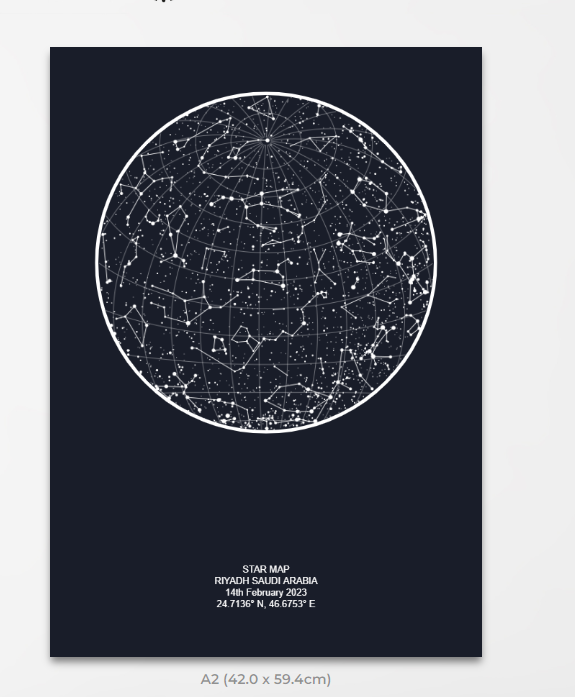
For February 14th 2023, the map produced my MapsForMoments is:

enter image description here

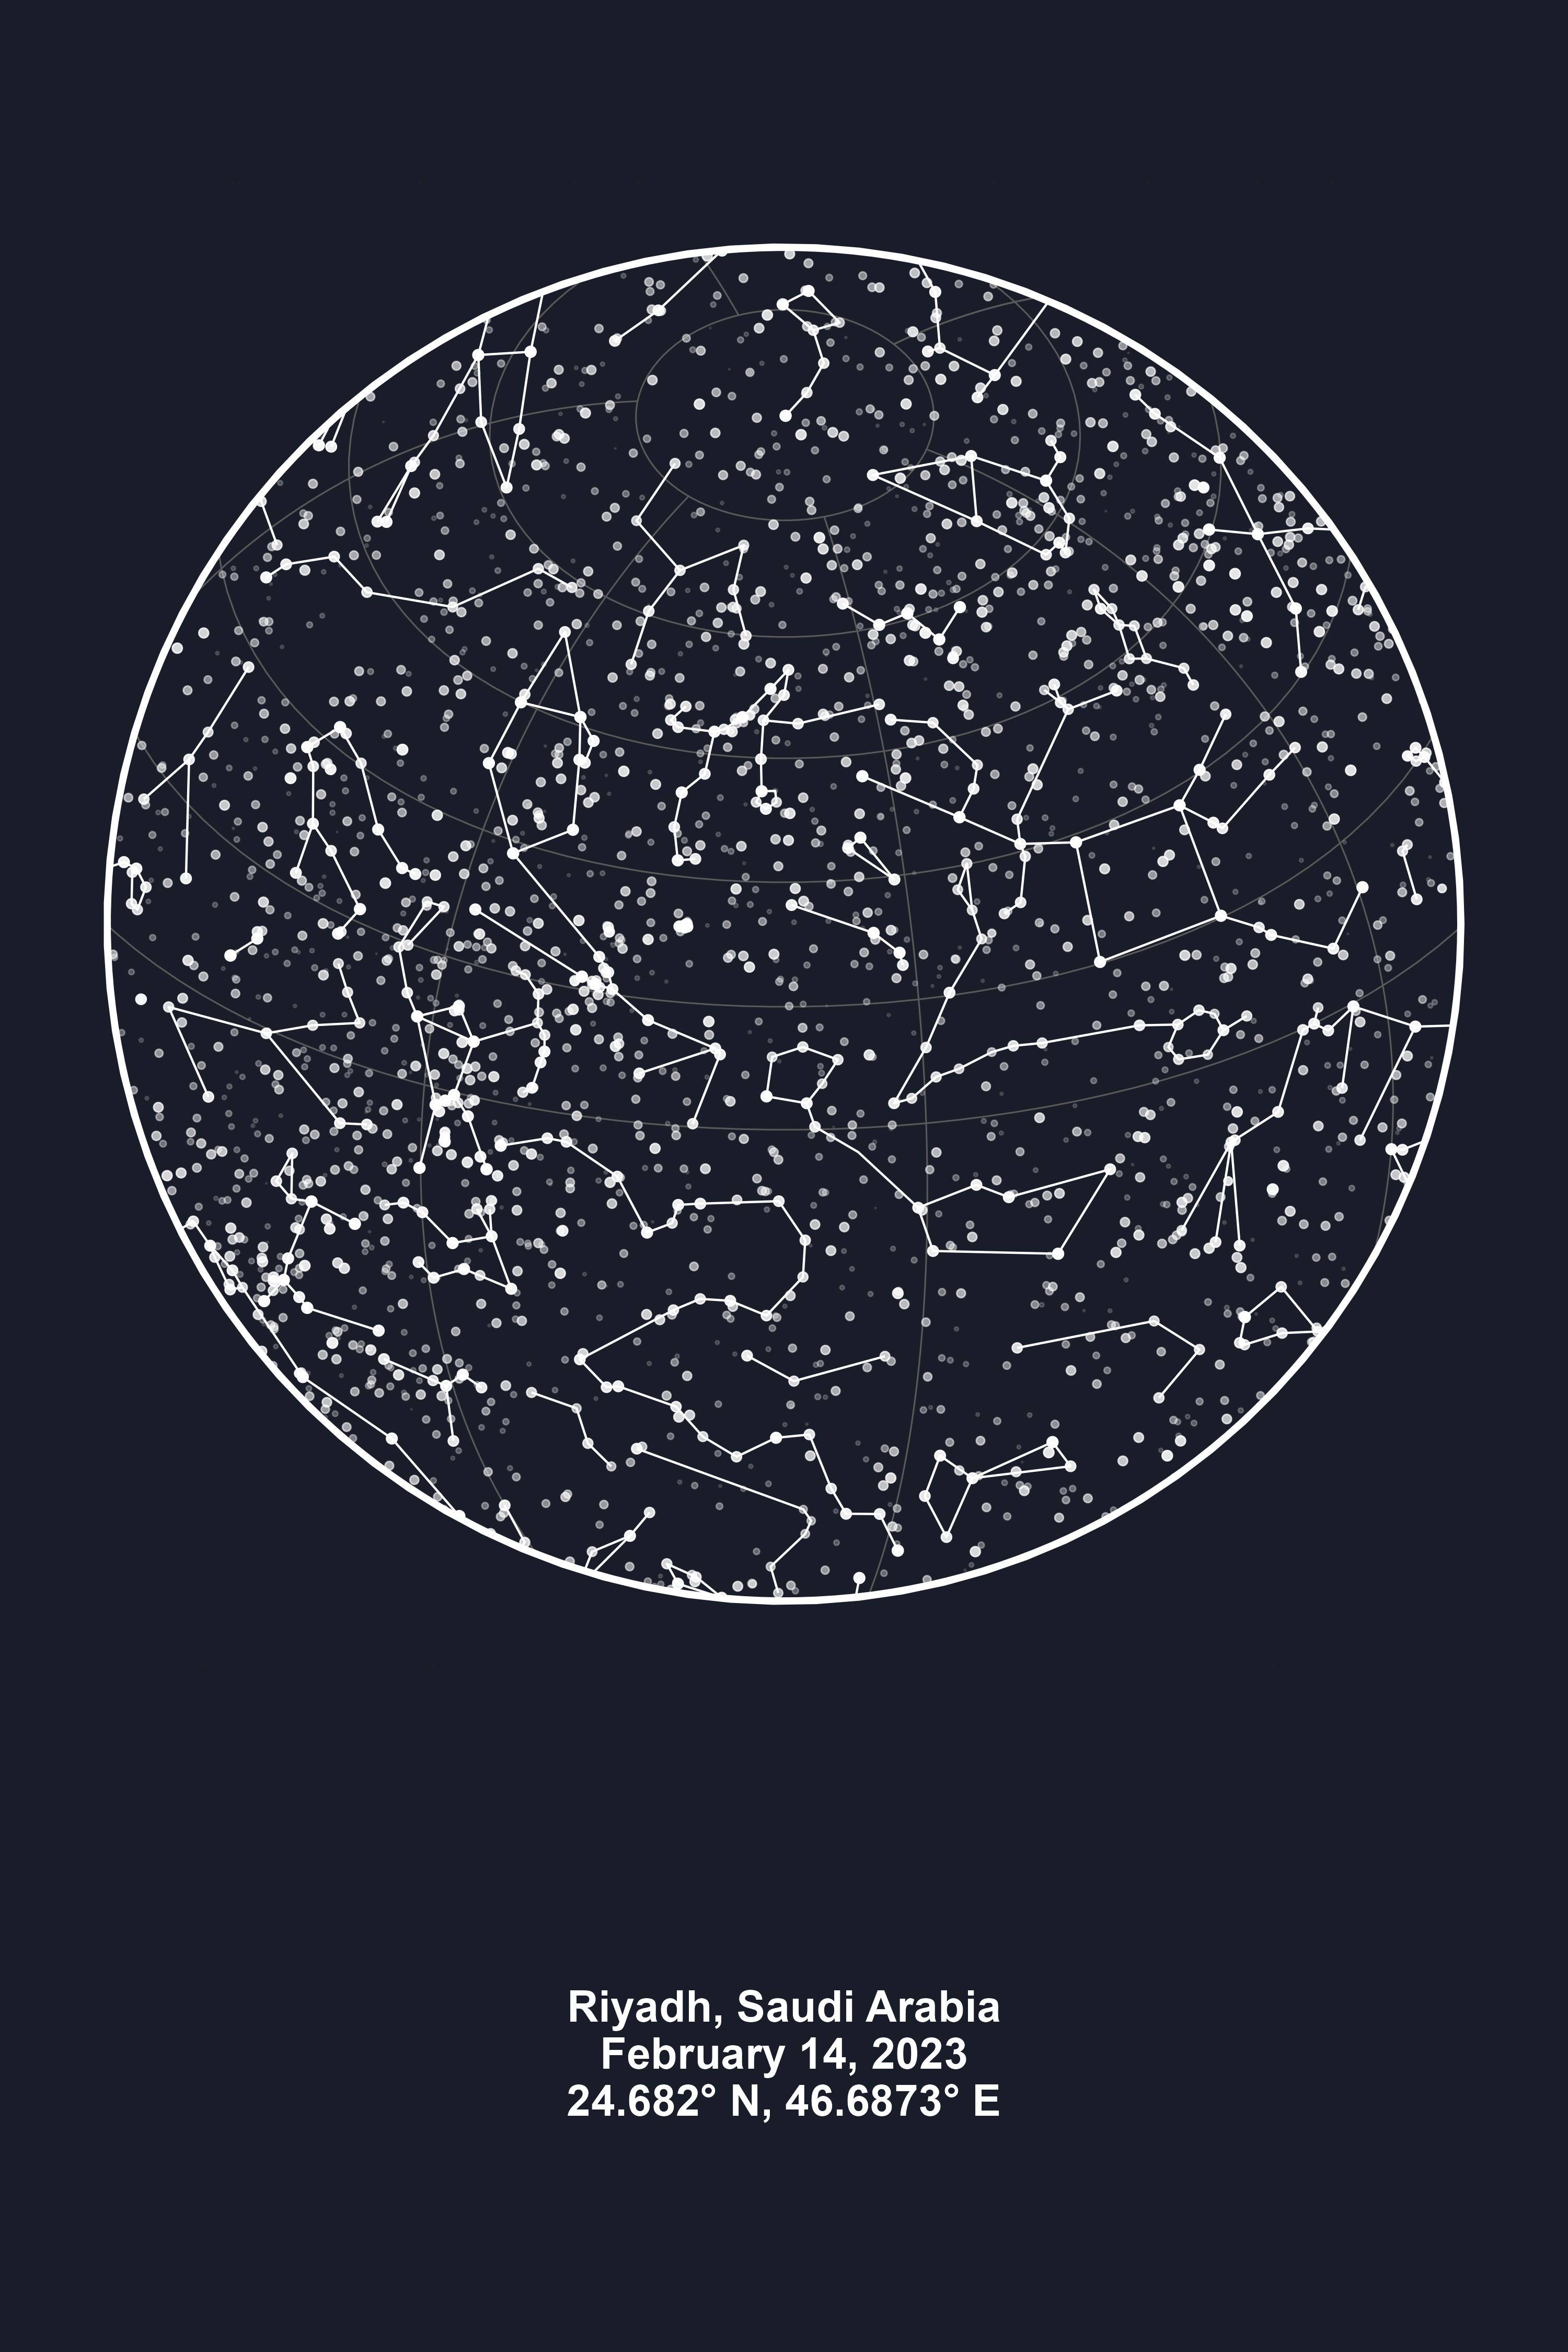
However, the visual produced by the code above is:

p<-plot_starmap( "Riyadh, Saudi Arabia",
              date="2023-02-14")

ggsave('saudi.jpg', plot = p, width = unit(10, 'in'), height = unit(15, 'in'))

enter image description here

A more focused look

The present approach that I have for calculating the CRS in the code above is the following:


 gocodeData <-  tibble(singlelineaddress = location) %>%
                     geocode(address=singlelineaddress,method = 'arcgis')
# Cleaning up date arg
date<- as.Date(date)

# Formatted date
dt<- lubridate::ymd(date)

lat <- gocodeData %>% .[["lat"]]


ref_date <- paste0(year(dt),"01","01",sep="-") %>% ydm()
# Resulting longitude
lon <- (-as.numeric(difftime(ref_date,dt, units="days"))/365)*360 %>% round(4)

# The CRS

projString <- paste0("+proj=laea +x_0=0 +y_0=0 +lon_0=",lon, " +lat_0=", lat)

I believe the issue is with the longitude value more than the latitude.

3
  • Hmmm there's a lot to unpick in your code. I assume somewhere it considers that you want a view looking from the centre of a sphere outwards, which is opposite to conventional cartography. Is that what the "flip" does? You should maybe try and break it up into testable functions, I assume a key part of this is taking the viewer's lat-long and time and working out the overhead point "lat-long" on the celestial sphere? There should be a function then that just does that (no graphics etc) for testing. A monolithic structure like this is difficult.
    – Spacedman
    Commented Feb 21, 2023 at 16:55
  • @Spacedman We need a way to flip the longitude co-ordinates to make it appear that we are looking up at a celestial sphere rather than down on one. "flip" does the affine transformation to accomidate that.
    – Bensstats
    Commented Feb 21, 2023 at 17:13
  • Hi Bensstats, I needed to work a lot on that for this blog post: dieghernan.github.io/202301_star-map-R See the custom function get_mst() . Also Maps for moments assumes the exact time at 22:00 UTC regardless of the time zone of your coordinates (that is not correct). Hope that helps
    – dieghernan
    Commented Feb 21, 2023 at 19:37

1 Answer 1

1

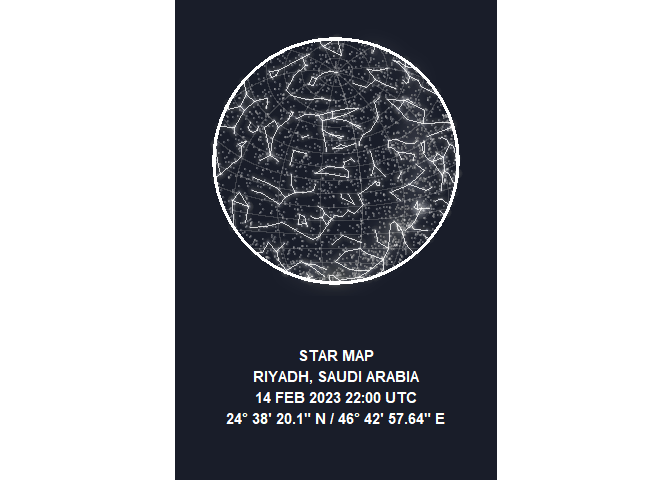
I don't know if this would be accepted as a proper answer. Here is the code, the full explanation is on this long post. Also, the online shops creates a incorrect map sometimes, since for a given date these sites creates the map of a location at 22:00 UTC, that may not be night time at the given location (i.e. 22:00 UTC may be 11:00 AM in Auckland, NZ where the only visible star is the Sun obviously)

library(lubridate)
#> 
#> Attaching package: 'lubridate'
#> The following objects are masked from 'package:base':
#> 
#>     date, intersect, setdiff, union

# Inputs
desired_place <- "Riyadh, Saudi Arabia"

# We are not using yet the timezone
desired_date <- make_datetime(
  year = 2023,
  month = 02,
  day = 14,
  hour = 22,
  min = 00
)

desired_date_tz <- force_tz(desired_date, "UTC")

# Spatial manipulation
library(sf)
#> Linking to GEOS 3.9.3, GDAL 3.5.2, PROJ 8.2.1; sf_use_s2() is TRUE
library(s2)
library(nominatimlite)

## Wrange data and dates
library(dplyr)
#> 
#> Attaching package: 'dplyr'
#> The following objects are masked from 'package:stats':
#> 
#>     filter, lag
#> The following objects are masked from 'package:base':
#> 
#>     intersect, setdiff, setequal, union
library(lubridate)
library(lutz)

## Visualization
library(ggplot2)
library(ggfx)
library(ggshadow)
load_celestial <- function(filename,
                           url = "https://cdn.jsdelivr.net/gh/dieghernan/celestial_data@main/data/",
                           cachedir = tempdir()) {
  if (!dir.exists(cachedir)) {
    stop(
      "Please create ",
      path.expand(cachedir),
      " directory",
      "first"
    )
  }

  url <- file.path(url, filename)
  local_path <- file.path(cachedir, filename)


  if (!file.exists(local_path)) {
    download.file(url, local_path, mode = "wb", quiet = TRUE)
  }

  celestial <- sf::st_read(local_path, quiet = TRUE)

  return(celestial)
}

pretty_lonlat <- function(x, type, accuracy = 2) {
  positive <- x >= 0

  # Decompose
  x <- abs(x)
  D <- as.integer(x)
  m <- (x - D) * 60
  M <- as.integer(m)
  S <- round((m - M) * 60, accuracy)

  # Get label
  if (type == "lon") {
    lab <- ifelse(positive > 0, "E", "W")
  } else {
    lab <- ifelse(positive > 0, "N", "S")
  }


  # Compose
  label <- paste0(D, "\u00b0 ", M, "' ", S, '\" ', lab)
  return(label)
}


# Derive rotation degrees of the projection given a date and a longitude
get_mst <- function(dt, lng) {
  desired_date_utc <- lubridate::with_tz(dt, "UTC")


  yr <- lubridate::year(desired_date_utc)
  mo <- lubridate::month(desired_date_utc)
  dy <- lubridate::day(desired_date_utc)
  h <- lubridate::hour(desired_date_utc)
  m <- lubridate::minute(desired_date_utc)
  s <- lubridate::second(desired_date_utc)

  if ((mo == 1) || (mo == 2)) {
    yr <- yr - 1
    mo <- mo + 12
  }

  # Adjust times before Gregorian Calendar
  # See https://squarewidget.com/julian-day/
  if (lubridate::as_date(dt) > as.Date("1582-10-14")) {
    a <- floor(yr / 100)
    b <- 2 - a + floor(a / 4)
  } else {
    b <- 0
  }
  c <- floor(365.25 * yr)
  d <- floor(30.6001 * (mo + 1))

  # days since J2000.0
  jd <- b + c + d - 730550.5 + dy + (h + m / 60 + s / 3600) / 24
  jt <- jd / 36525

  # Rotation
  mst <- 280.46061837 + 360.98564736629 * jd +
    0.000387933 * jt^2 - jt^3 / 38710000.0 + lng

  # Modulo 360 degrees
  mst <- mst %% 360

  return(mst)
}
# Cut a sf object with a buffer using spherical s2 geoms
# Optionally, project and flip

sf_spherical_cut <- function(x, the_buff, the_crs = sf::st_crs(x), flip = NULL) {
  # Get geometry type
  geomtype <- unique(gsub("MULTI", "", sf::st_geometry_type(x)))[1]

  # Keep the data frame, s2 drops it
  the_df <- sf::st_drop_geometry(x)
  the_geom <- sf::st_geometry(x)
  # Convert to s2 if needed
  if (!inherits(the_buff, "s2_geography")) {
    the_buff <- sf::st_as_s2(the_buff)
  }

  the_cut <- the_geom %>%
    # Cut with s2
    sf::st_as_s2() %>%
    s2::s2_intersection(the_buff) %>%
    # Back to sf and add the df
    sf::st_as_sfc() %>%
    sf::st_sf(the_df, geometry = .) %>%
    dplyr::filter(!sf::st_is_empty(.)) %>%
    sf::st_transform(crs = the_crs)

  # If it is not POINT filter by valid and non-empty
  # This if for performance
  if (!geomtype == "POINT") {
    # If any is GEOMETRYCOLLECTION extract the right value
    if (any(sf::st_geometry_type(the_cut) == "GEOMETRYCOLLECTION")) {
      the_cut <- the_cut %>%
        sf::st_collection_extract(type = geomtype, warn = FALSE)
    }

    the_cut <- the_cut %>%
      dplyr::filter(!is.na(sf::st_is_valid(.)))
  }

  if (!is.null(flip)) {
    the_cut <- the_cut %>%
      dplyr::mutate(geometry = geometry * flip) %>%
      sf::st_set_crs(the_crs)
  }

  return(the_cut)
}


# Geocode place with nominatimlite
desired_place_geo <- geo_lite(desired_place, full_results = TRUE)

desired_place_geo %>%
  select(address, lat, lon)
#> # A tibble: 1 × 3
#>   address                                                        lat   lon
#>   <chr>                                                        <dbl> <dbl>
#> 1 الرياض, المالز, محافظة الرياض, منطقة الرياض, 11131, السعودية  24.6  46.7

# And get the coordinates
desired_loc <- desired_place_geo %>%
  select(lat, lon) %>%
  unlist()

desired_loc
#>      lat      lon 
#> 24.63892 46.71601
# Get the rotation and prepare buffer and projection

# Get right degrees
lon_prj <- get_mst(desired_date_tz, desired_loc[2])
lat_prj <- desired_loc[1]

c(lon_prj, lat_prj)
#>       lon       lat 
#> 161.37934  24.63892

# Create proj4string w/ Airy projection

target_crs <- paste0("+proj=airy +x_0=0 +y_0=0 +lon_0=", lon_prj, " +lat_0=", lat_prj)


target_crs
#> [1] "+proj=airy +x_0=0 +y_0=0 +lon_0=161.379344231915 +lat_0=24.638916"

# We need to flip celestial objects to get the impression of see from the Earth
# to the sky, instead of from the sky to the Earth
# https://stackoverflow.com/a/75064359/7877917
# Flip matrix for affine transformation

flip_matrix <- matrix(c(-1, 0, 0, 1), 2, 2)


# And create an s2 buffer of the visible hemisphere at the given location
hemisphere_s2 <- s2_buffer_cells(
  as_s2_geography(
    paste0("POINT(", lon_prj, " ", lat_prj, ")")
  ),
  9800000,
  max_cells = 5000
)

# This one is for plotting
hemisphere_sf <- hemisphere_s2 %>%
  st_as_sf() %>%
  st_transform(crs = target_crs) %>%
  st_make_valid()
mw <- load_celestial("mw.min.geojson")

# Add colors to MW to use on fill
cols <- colorRampPalette(c("white", "yellow"))(5)
mw$fill <- factor(cols, levels = cols)


# And process it

# Cut to buffer
mw_end <- sf_spherical_cut(mw,
  the_buff = hemisphere_s2,
  # Change the crs
  the_crs = target_crs,
  flip = flip_matrix
)
const <- load_celestial("constellations.lines.min.geojson")

# Cut to buffer

const_end <- sf_spherical_cut(const,
  the_buff = hemisphere_s2,
  # Change the crs
  the_crs = target_crs,
  flip = flip_matrix
)
stars <- load_celestial("stars.6.min.geojson")


# Cut to buffer

stars_end <- sf_spherical_cut(stars,
  the_buff = hemisphere_s2,
  # Change the crs
  the_crs = target_crs,
  flip = flip_matrix
)
grat <- st_graticule(
  ndiscr = 5000,
  lat = seq(-90, 90, 10),
  lon = seq(-180, 180, 30)
)

# Cut to buffer, we dont flip this one (it is not an object of the space)
grat_end <- sf_spherical_cut(
  x = grat,
  the_buff = hemisphere_s2,
  # Change the crs
  the_crs = target_crs
)
lat_lab <- pretty_lonlat(desired_loc[1], type = "lat")
lon_lab <- pretty_lonlat(desired_loc[2], type = "lon")

pretty_labs <- paste(lat_lab, "/", lon_lab)

cat(pretty_labs)
#> 24° 38' 20.1" N / 46° 42' 57.64" E

# Create final caption to put on bottom

pretty_time <- paste(
  # Pretty Day
  scales::label_date(
    format = "%d %b %Y",
    locale = "en"
  )(desired_date_tz),
  # Pretty Hour
  format(desired_date_tz, format = "%H:%M", usetz = TRUE)
)

cat(pretty_time)
#> 14 Feb 2023 22:00 UTC

# Our final caption
caption <- toupper(paste0(
  "Star Map\n",
  desired_place, "\n",
  pretty_time, "\n",
  pretty_labs
))


cat(caption)
#> STAR MAP
#> RIYADH, SAUDI ARABIA
#> 14 FEB 2023 22:00 UTC
#> 24° 38' 20.1" N / 46° 42' 57.64" E
# Prepare MULTILINESTRING

const_end_lines <- const_end %>%
  st_cast("MULTILINESTRING") %>%
  st_coordinates() %>%
  as.data.frame()


ggplot() +
  # Graticules
  geom_sf(data = grat_end, color = "grey60", linewidth = 0.25, alpha = 0.3) +
  # A blurry Milky Way
  with_blur(
    geom_sf(
      data = mw_end, aes(fill = fill), alpha = 0.1, color = NA,
      show.legend = FALSE
    ),
    sigma = 8
  ) +
  scale_fill_identity() +
  # Glowing stars
  geom_glowpoint(
    data = stars_end, aes(
      alpha = br, size =
        br, geometry = geometry
    ),
    color = "white", show.legend = FALSE, stat = "sf_coordinates"
  ) +
  scale_size_continuous(range = c(0.05, 0.75)) +
  scale_alpha_continuous(range = c(0.1, 0.5)) +
  # Glowing constellations
  geom_glowpath(
    data = const_end_lines, aes(X, Y, group = interaction(L1, L2)),
    color = "white", size = 0.5, alpha = 0.8, shadowsize = 0.4, shadowalpha = 0.01,
    shadowcolor = "white", linejoin = "round", lineend = "round"
  ) +
  # Border of the sphere
  geom_sf(data = hemisphere_sf, fill = NA, color = "white", linewidth = 1.25) +
  # Caption
  labs(caption = caption) +
  # And end with theming
  theme_void() +
  theme(
    text = element_text(colour = "white"),
    panel.border = element_blank(),
    plot.background = element_rect(fill = "#191d29", color = "#191d29"),
    plot.margin = margin(20, 20, 20, 20),
    plot.caption = element_text(
      hjust = 0.5, face = "bold",
      size = rel(1),
      lineheight = rel(1.2),
      margin = margin(t = 40, b = 20)
    )
  )
#> Warning in CPL_transform(x, crs, aoi, pipeline, reverse, desired_accuracy, :
#> GDAL Error 1: PROJ: pipeline: Pipeline: A forward operation couldn't be
#> constructed

Created on 2023-02-21 with reprex v2.0.2

Your Answer

By clicking “Post Your Answer”, you agree to our terms of service and acknowledge you have read our privacy policy.

Not the answer you're looking for? Browse other questions tagged or ask your own question.