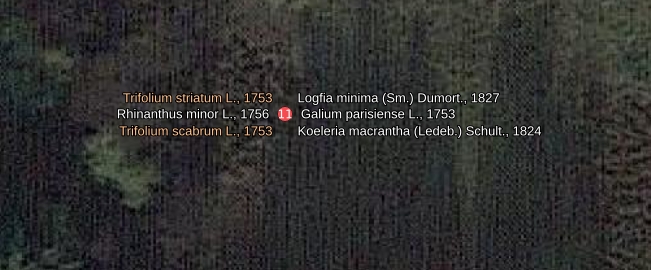
I am trying to show more than 6 point labels that are all at the exact same coordinates.
Using the feature "Show all labels for this feature" make them stack in one spot, which is not readable.
Also, I have thousands of points on this map, so placing the labels manually is not possible.
I did play with the "Distance" setting in Labels>Placement, but I can't seem to show more than 6.
Is it possible?
-
2Use cartographic placement and increase distance. See: gis.stackexchange.com/a/450821/88814– BabelCommented Apr 4, 2023 at 15:14
-
@Babel, I tried but it still won't show more than 6 labels.– aguilbauCommented Apr 4, 2023 at 15:20
2 Answers
Use Geometry Generator for full control of no. of labels and their placement
By default, QGIS uses max. 8 different positions for label placement as established best practice in cartography is to have 8 candidates of placecement:
For each point, there exists a set of possible label positions, also known as a set of candidate positions, and the objective is to find a combination of these candidate positions that produces the best legibility in a map. This set of potential label positions indicates their desirability, also known as cartographic standardization (Christensen et al., 1995). G. L. Cravo, G. M. Ribeiro, L. A. N. Lorena (2008): A greedy randomized adaptive search procedure for the point-feature cartographic label placement, Computers & Geosciences Vol. 34, no. 4, p. 373-386, https://www.sciencedirect.com/science/article/pii/S0098300407001033
Cartographic preferences, from 1 (most preferred) to 8 (least preferred): - from best to worst: 1) north east, 2) north west, 3) south west, 4) south east, 5) north, 6) west, 7) south, 8) east
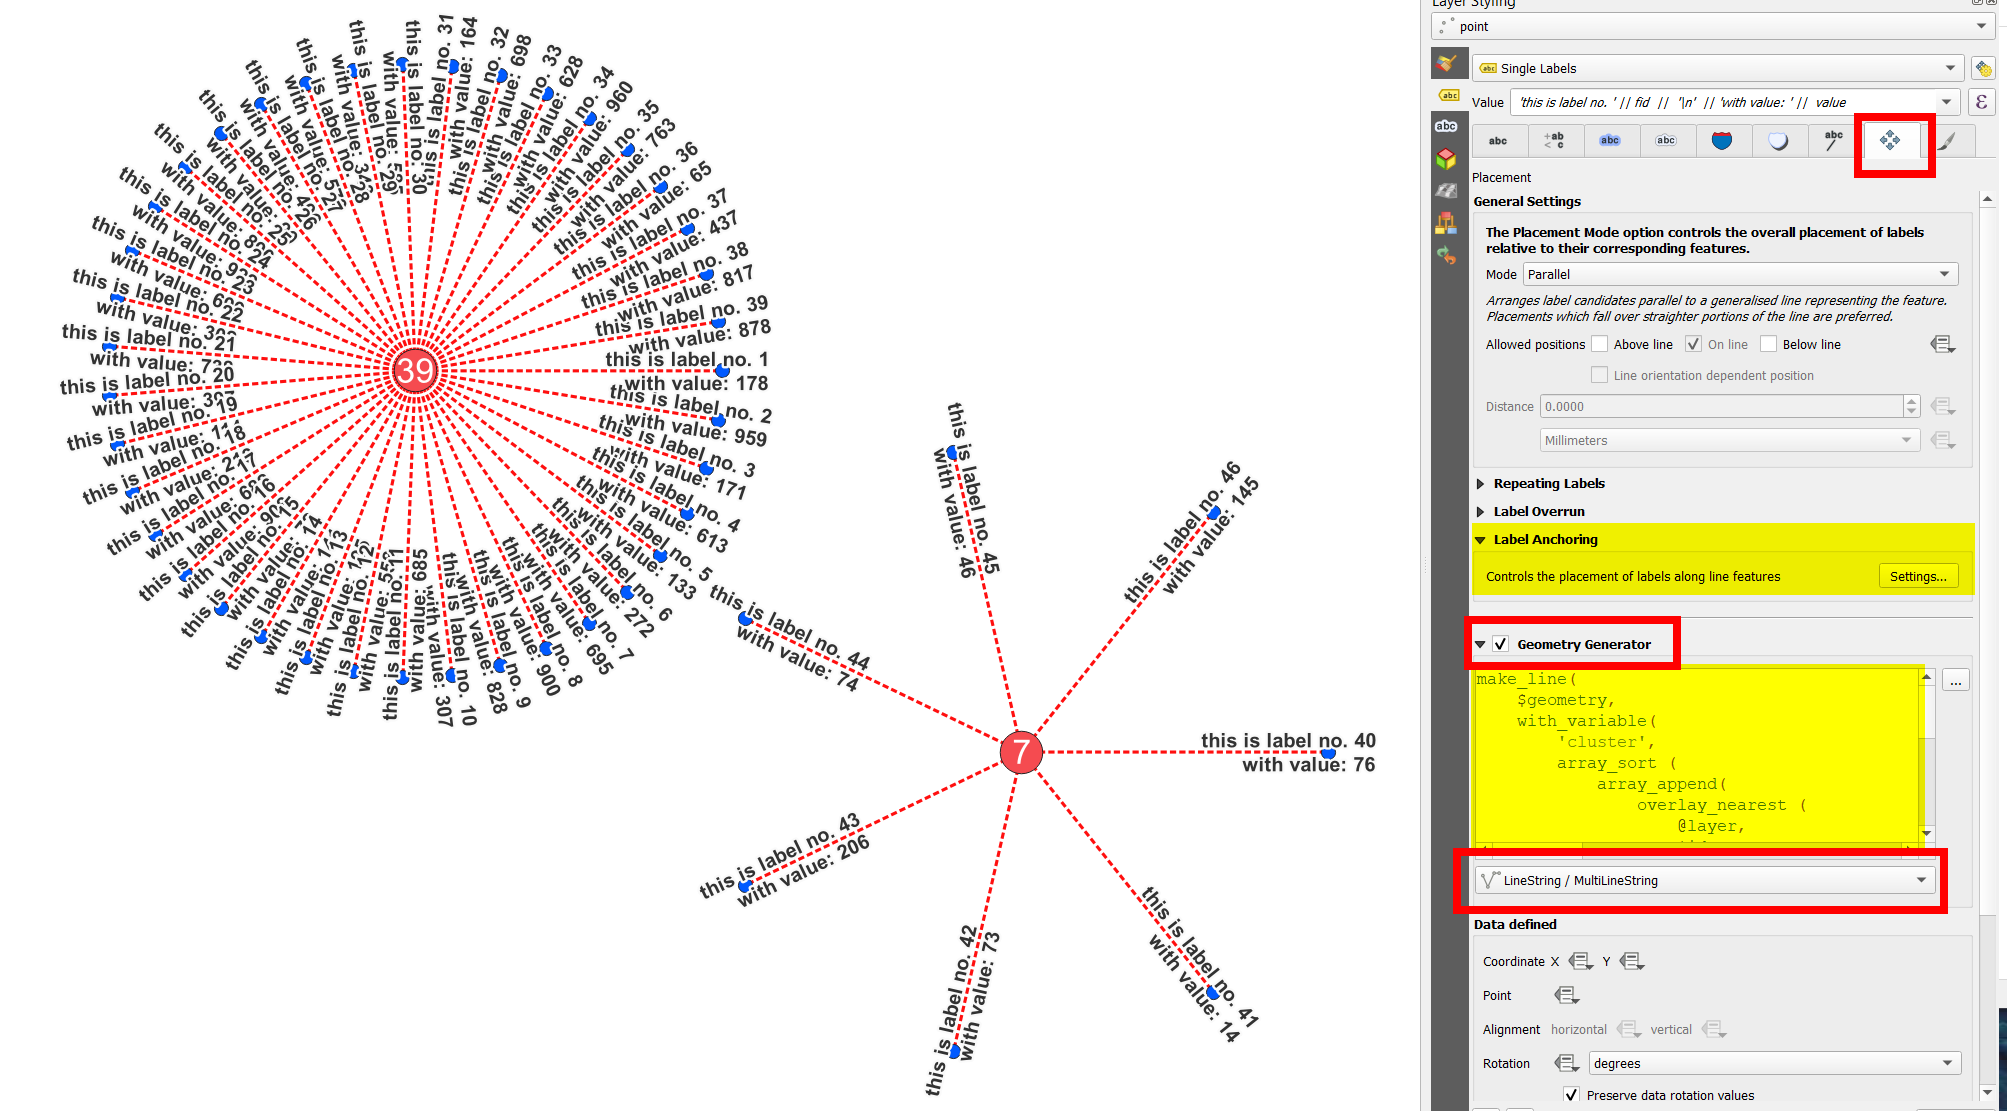
So you need to override this to create more than 8 labels. Geometry Generator gives you the option to create geometries that gives you full control of where to place labels and how many labels will be created. In the Placement tab, active Geoemtry Generator. See this example:
Labels placed at the end point (blue dot) of lines (red dotted) created with geometry generator; dots and lines added just for visualization purpose:
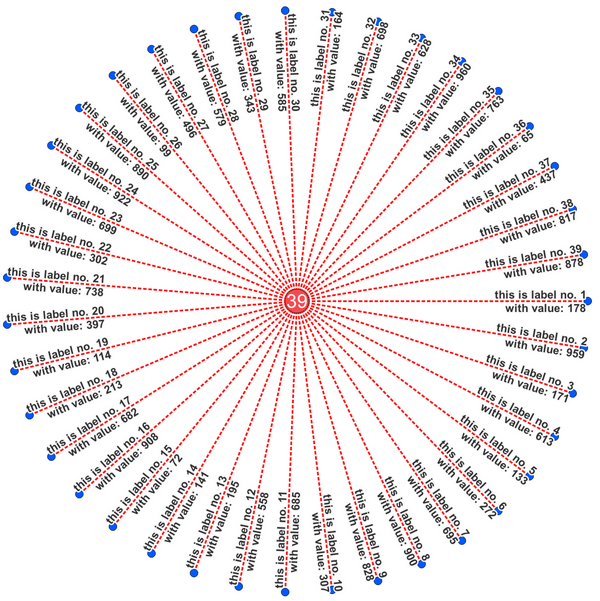
Example: radial labels in regular intervals
Collect the id of all the points clustered in the same place by creating an array with overlay_nearest() function. For each of the clustered features, create a line starting from the location of the point, but with an individual azimuth. For this, divide the full 360 degrees by the number of clustered points to create lines at regular (angular) intervals. For each ids then multiply this angle-interval by the position of the current id in the array to get an individual line for each feature.
Then use project() function to create a 2nd point shifted from the location of the initial (1st) point at a certain distance and angle. Connect these two points by a line: the red dotted lines in the screenshot above.
The expression used - change the length (here: 190) of the line (and thus the distance of the label from the point to be labeled) on the 5th last line:
make_line(
    $geometry,
    with_variable(
        'cluster',
        array_sort (
            array_append(
                overlay_nearest (
                    @layer,
                    $id,
                    limit:=-1
                ),
                $id
            )
        ),
        project (
            $geometry,
            190,  -- change length of line here
            radians (90+360/array_length (@cluster) * array_find (@cluster, $id))
        )
    )
)
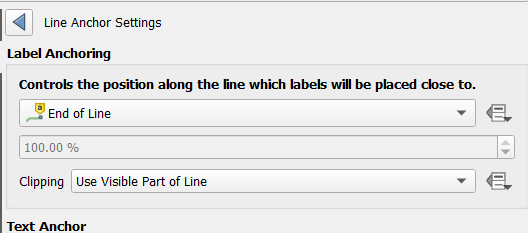
Place the labels on this line - enter Label Anchoring settings to define where on the line the labels should appear. I opted for End of Line:
Depending on how close the labels are, some of them will overlap and thus not all will show up. Change this in the Rendering tab > Overlapping Labels and set Mode to Allow Overlaps without Penalty.
For label placement, see also: https://www.e-education.psu.edu/geog486/node/557
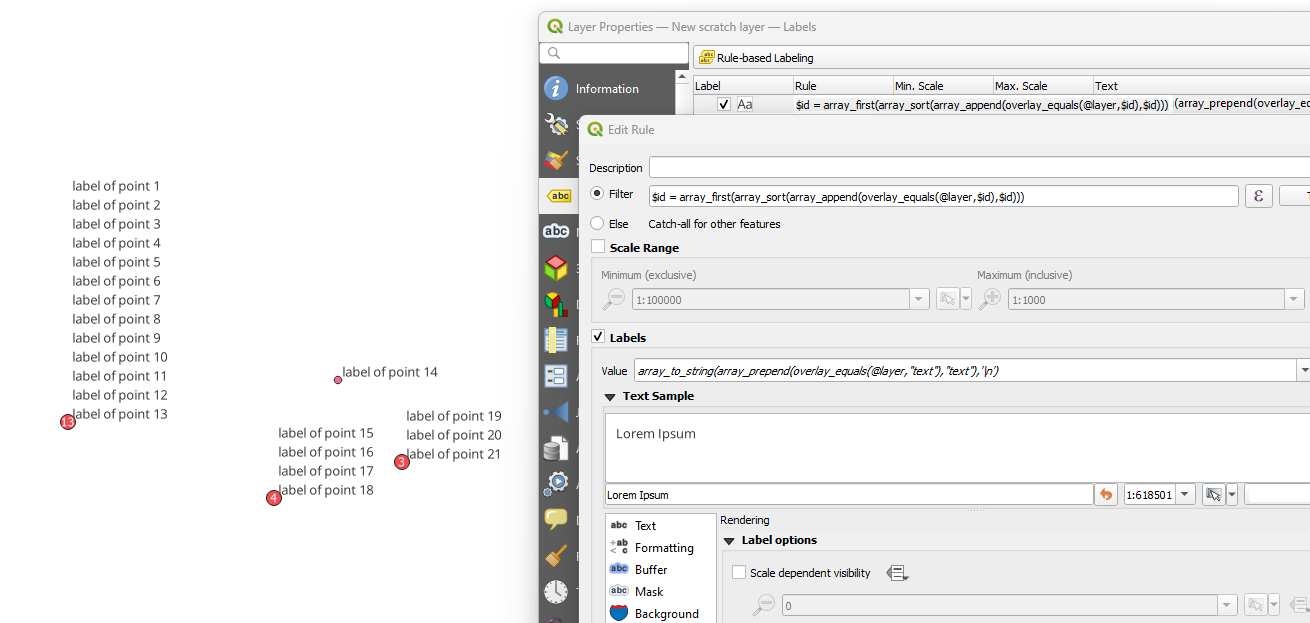
Even though this is not good cartography, you could set up a rule based label with a filter like
$id = array_first(array_sort(array_append(overlay_equals(@layer,$id),$id)))
to ensure only one point of each group/place gets a label. Then use an expression such as
array_to_string(array_prepend(overlay_equals(@layer,"text"),"text"),'\n')
as label text. This expression aggregates all "text" fields of the overlapping points into one label, delimited by a line break.
-
Thank you ! It is very very slow, but it can do the trick. However, I think there is a problem with the expression, as it shows n-1 labels (if there are 4 stacked points, only 3 labels will be shown).– aguilbauCommented Apr 4, 2023 at 15:25
-
-
2Don't overlook the first sentence of this answer. The important point is that you are asking for a way to make a bad map. The better approach is to rethink your map and what you are trying to communicate to your user.– LlavesCommented Apr 4, 2023 at 20:15

