2

I am converting a 16-bit image to an 8-bit for an ML dataset.

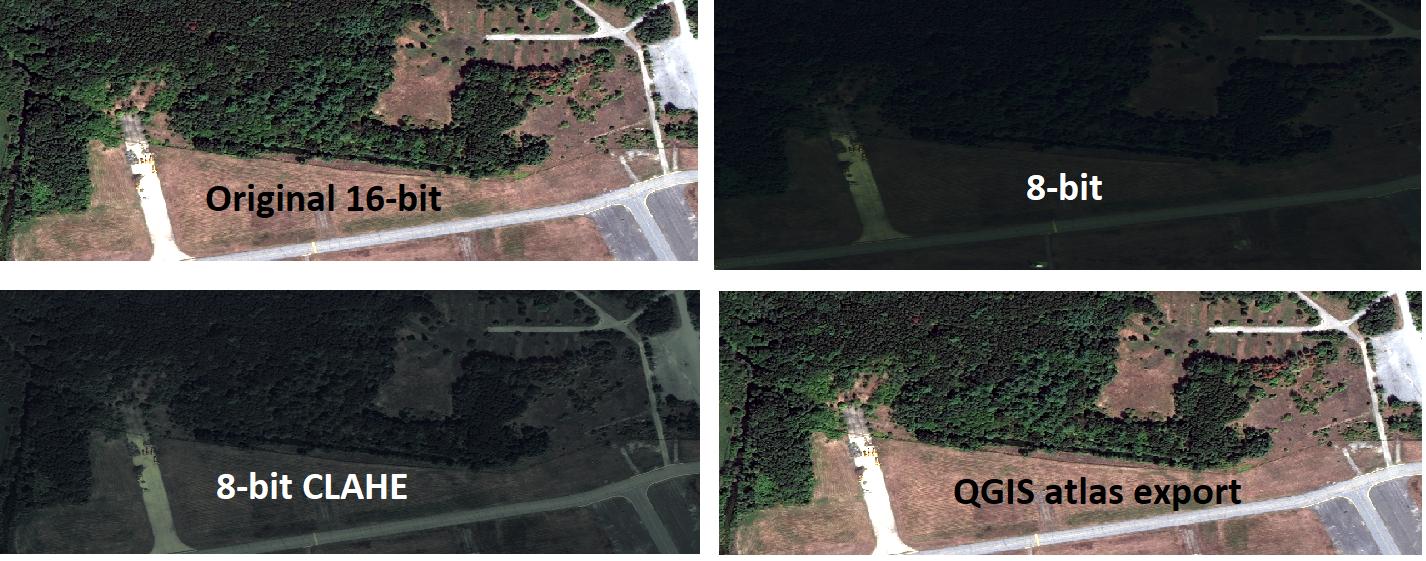
The conversion script considers the min and max values of each band instead of a linear scale from 0-65535 to 0-255. However, the 8-bit image is appearing low contrast.

from osgeo import gdal

def scale_to_8bit(data, min_val, max_val):
    scaled_data = ((data - min_val) / (max_val - min_val)) * 255.0
    return scaled_data.astype('uint8')

def convert_16bit_to_8bit(input_path, output_path):
    # Open the 16-bit GeoTIFF image
    dataset = gdal.Open(input_path)

    if dataset is None:
        raise ValueError("Error: Unable to open the input GeoTIFF file.")

    # Read image data and find the minimum and maximum values per channel
    band_count = dataset.RasterCount
    min_values = [float('inf')] * band_count
    max_values = [float('-inf')] * band_count

    for band_num in range(1, band_count + 1):
        band = dataset.GetRasterBand(band_num)
        data = band.ReadAsArray()
        min_values[band_num - 1] = data.min()
        max_values[band_num - 1] = data.max()

    # Create a new 8-bit GeoTIFF
    driver = gdal.GetDriverByName("GTiff")
    output_dataset = driver.Create(
        output_path,
        dataset.RasterXSize,
        dataset.RasterYSize,
        band_count,
        gdal.GDT_Byte
    )

    # Apply scaling and write data to the new GeoTIFF
    for band_num in range(1, band_count + 1):
        band = dataset.GetRasterBand(band_num)
        data = band.ReadAsArray()
        scaled_data = scale_to_8bit(data, min_values[band_num - 1], max_values[band_num - 1])
        output_band = output_dataset.GetRasterBand(band_num)
        output_band.WriteArray(scaled_data)

    # Set geotransform and projection information
    output_dataset.SetGeoTransform(dataset.GetGeoTransform())
    output_dataset.SetProjection(dataset.GetProjection())

    # Save changes and close datasets
    output_dataset.FlushCache()
    output_dataset = None
    dataset = None

#if __name__ == "__main__":
input_tiff_path = r'C:\Data\Raster_Images\16bit.tif'
output_tiff_path = r'C:\Data\Raster_Images\8bit.png'

convert_16bit_to_8bit(input_tiff_path, output_tiff_path)

I tried to improve further using the CLAHE algorithm, which marginally increased clarity. However, when I export the map as an Image or as an atlas in QGIS, the output image is 8-bit but does not lose any quality.

import cv2
import numpy as np
import os 

def apply_LAB_CLAHE(src_image,out_folder):
    img = cv2.imread(src_image, 1)
    # converting to LAB color space
    lab= cv2.cvtColor(img, cv2.COLOR_BGR2LAB)
    l_channel, a, b = cv2.split(lab)

    # Applying CLAHE to L-channel
    # feel free to try different values for the limit and grid size:
    clahe = cv2.createCLAHE(clipLimit=2.0, tileGridSize=(8,8))
    cl = clahe.apply(l_channel)

    # merge the CLAHE enhanced L-channel with the a and b channel
    limg = cv2.merge((cl,a,b))

    # Converting image from LAB Color model to BGR color spcae
    enhanced_img = cv2.cvtColor(limg, cv2.COLOR_LAB2BGR)
    
    out_file=src_image.replace('PNG_8bit','PNG_8bit_CLAHE')
    cv2.imwrite(out_file,enhanced_img)
    # Stacking the original image with the enhanced image
    #result = np.hstack((img, enhanced_img))
    #plt.imshow( result)

Edit#1 Files placed at this link RGB value range for 16-bit image

  • R 45-314
  • G 167-480
  • B 169-362

enter image description here

4
  • Does the source data have nodata value set? If you print the min_values/max_values, do they show reasonable values?
    – user30184
    Commented Aug 4, 2023 at 12:50
  • 1
    maybe totally irrelevant, but could it also be an issue only of how data is displayed in qgis rather than an issue with conversion? Could it be that you still need to adjust our min-max values in the symbology pane of the 8-Bit output-data rather than using those of the 16-bit image?
    – Vincé
    Commented Aug 4, 2023 at 12:56
  • 2
    It is certainly the expectation that transforming a dataset with 65536 potential discrete values per band to one with only 256 will have data quality implications. Straight scaling is probably the wrong approach if you want to preserve contrast.
    – Vince
    Commented Aug 4, 2023 at 13:05
  • I do not see any colors in the output from the code which makes me think if something fails also with handling the R, G, and B bands separately.
    – user30184
    Commented Aug 4, 2023 at 17:36

1 Answer 1

0

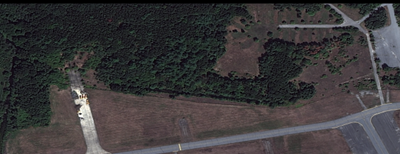
I made a test with gdal_translate by using options -ot Byte for creating an 8-bit output, and -scale for automatic histogram stretch

-scale [src_min src_max [dst_min dst_max]]

Rescale the input pixels values from the range src_min to src_max to the range dst_min to dst_max. If omitted the output range is 0 to 255. If omitted the input range is automatically computed from the source dataset, in its whole (not just the window of interest potentially specified with -srcwin or -projwin).

Thus with the following command the gdal_translate binary is doing the same thing that you try to do with your code.

gdal_translate -ot Byte -scale 16bit.tif 8bit.tif

The result looks like this:

enter image description here

Obviously you have some errors in your Python code. Unfortunately I am not good enough with reading the code so I cannot locate the place where the code does something else than what you expect.

Here are the band statistics of the 8-bit output

Band 1 Block=1482x1 Type=Byte, ColorInterp=Gray
  Minimum=0.000, Maximum=255.000, Mean=61.606, StdDev=32.112
  Metadata:
    STATISTICS_MAXIMUM=255
    STATISTICS_MEAN=61.6062922941
    STATISTICS_MINIMUM=0
    STATISTICS_STDDEV=32.111888580513
    STATISTICS_VALID_PERCENT=100
Band 2 Block=1482x1 Type=Byte, ColorInterp=Undefined
  Minimum=0.000, Maximum=255.000, Mean=59.532, StdDev=29.269
  Metadata:
    STATISTICS_MAXIMUM=255
    STATISTICS_MEAN=59.531766085108
    STATISTICS_MINIMUM=0
    STATISTICS_STDDEV=29.268590261247
    STATISTICS_VALID_PERCENT=100
Band 3 Block=1482x1 Type=Byte, ColorInterp=Undefined
  Minimum=0.000, Maximum=255.000, Mean=60.819, StdDev=30.302
  Metadata:
    STATISTICS_MAXIMUM=255
    STATISTICS_MEAN=60.818715472966
    STATISTICS_MINIMUM=0
    STATISTICS_STDDEV=30.30220339183
    STATISTICS_VALID_PERCENT=100

For comparison, the statistics of your 8bit.tif shows that max values of the bands are much lower than 255

Band 1 Block=1482x1 Type=Byte, ColorInterp=Red
  Minimum=0.000, Maximum=147.000, Mean=36.316, StdDev=19.471
  Metadata:
    STATISTICS_MAXIMUM=147
    STATISTICS_MEAN=36.316260352042
    STATISTICS_MINIMUM=0
    STATISTICS_STDDEV=19.470691463527
    STATISTICS_VALID_PERCENT=100
Band 2 Block=1482x1 Type=Byte, ColorInterp=Green
  Minimum=0.000, Maximum=162.000, Mean=41.579, StdDev=20.827
  Metadata:
    STATISTICS_MAXIMUM=162
    STATISTICS_MEAN=41.578611200109
    STATISTICS_MINIMUM=0
    STATISTICS_STDDEV=20.82748668801
    STATISTICS_VALID_PERCENT=100
Band 3 Block=1482x1 Type=Byte, ColorInterp=Blue
  Minimum=13.000, Maximum=115.000, Mean=43.224, StdDev=17.040
  Metadata:
    STATISTICS_MAXIMUM=115
    STATISTICS_MEAN=43.22400581559
    STATISTICS_MINIMUM=13
    STATISTICS_STDDEV=17.040405125382
    STATISTICS_VALID_PERCENT=100

Your Answer

By clicking “Post Your Answer”, you agree to our terms of service and acknowledge you have read our privacy policy.

Not the answer you're looking for? Browse other questions tagged or ask your own question.