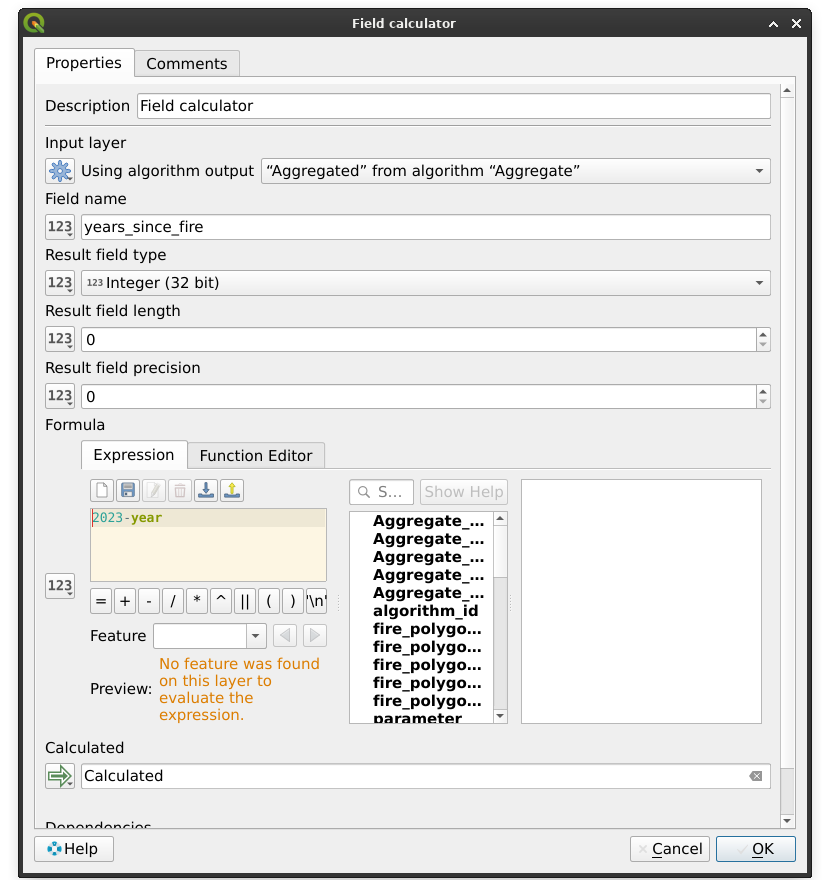
Using QGIS I want to create maps which visualise the fire history of an area, in particular the time since the last fire. I have a shapefile which contains polygons of each fire that has occurred in the past ~60 years. Each fire is a unique polygon with a unique feature. Some fires overlap, partially or totally. How do I calculate the time since the last fire (from 2023) for every patch of fire?
To do this I will need to be able to identify the most recent burnt area at any location, and then subtracting the fire year that from the current year. Identifying the most recent fire might will not be as simple as selecting whole polygons, as some polygons will have smaller fires on top that are more recent. For example in the picture below: If the orange fire (circle) occurred in 2020, and then the blue diamond fire occurred on top of that area in 2022, the area covered by orange time since fire would = 3, where as the area covered by the blue would have a time since fire of 1.
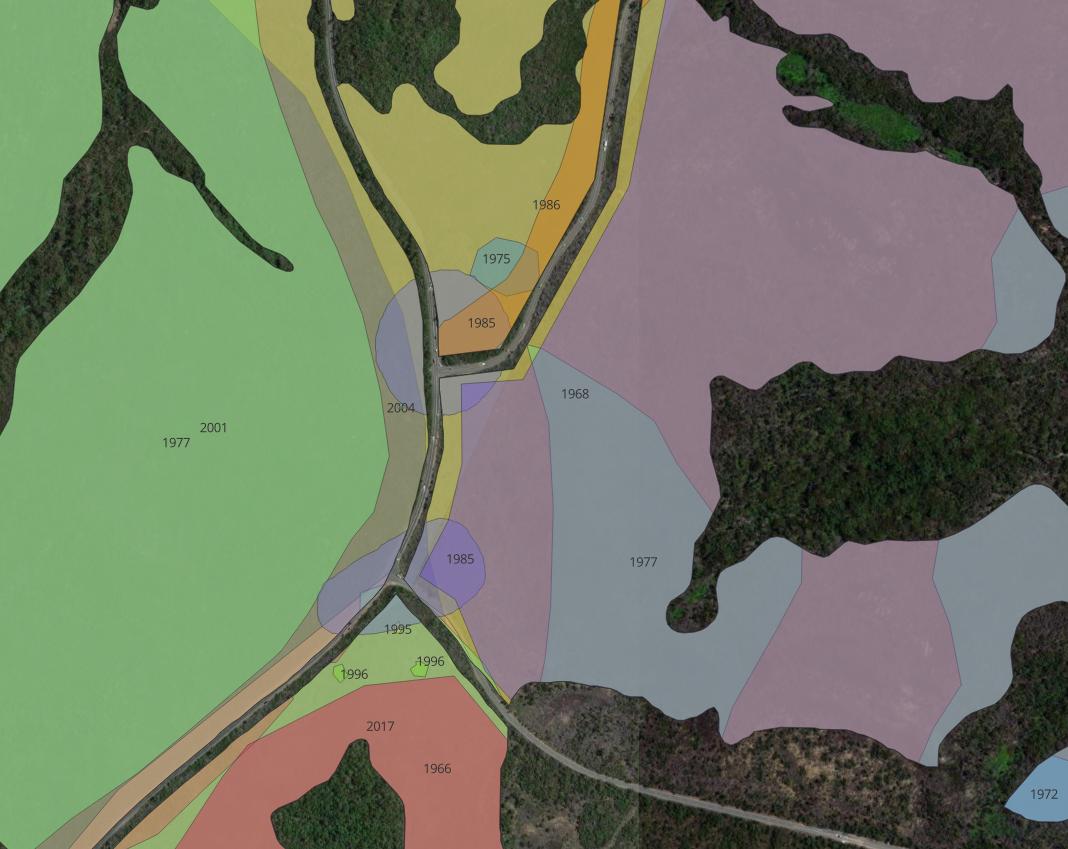
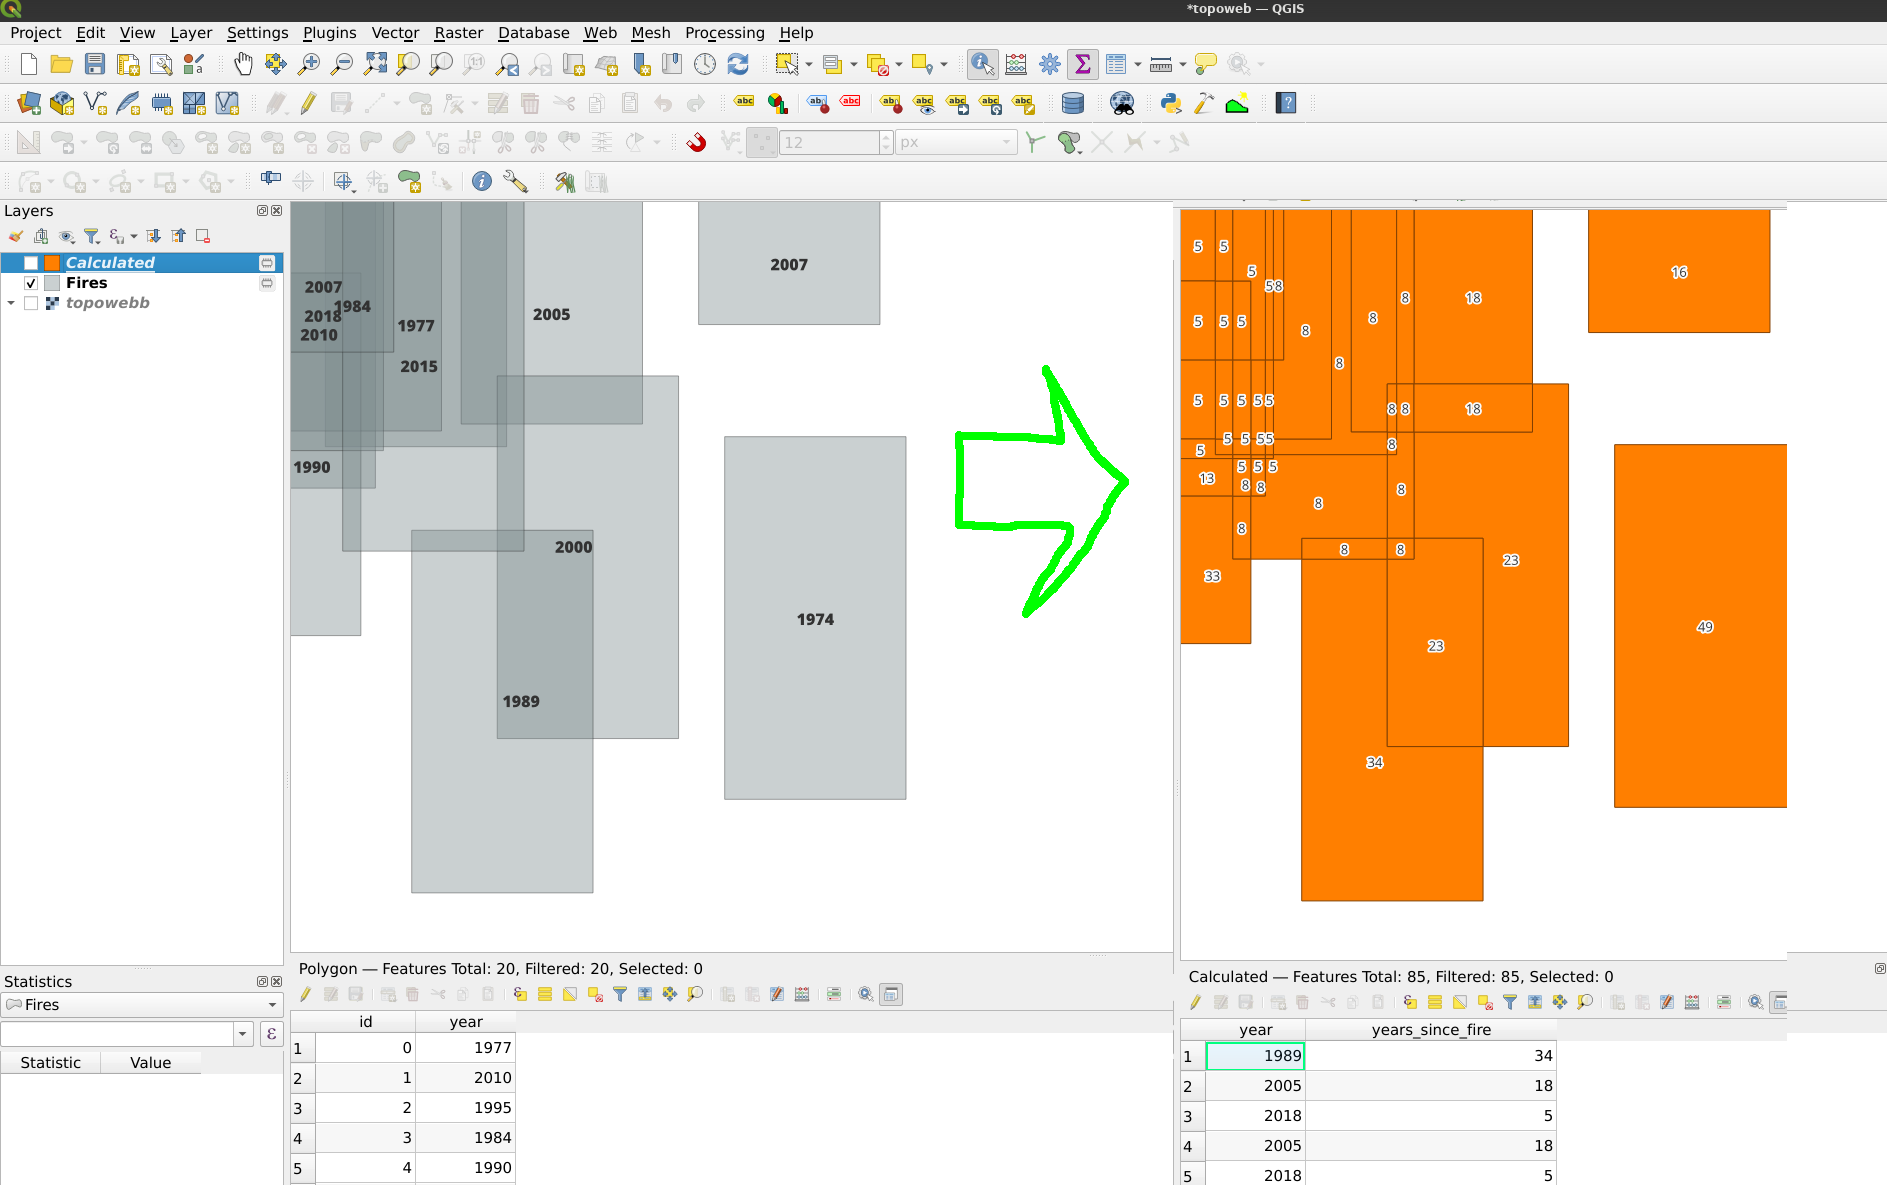
The image below shows the fire history shapefile with labels for the various years of fire (some of which the polygons are hidden beneath the top layered polygon)


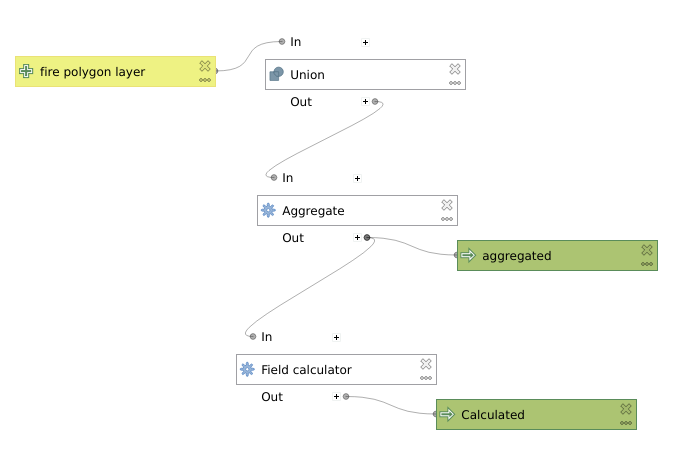
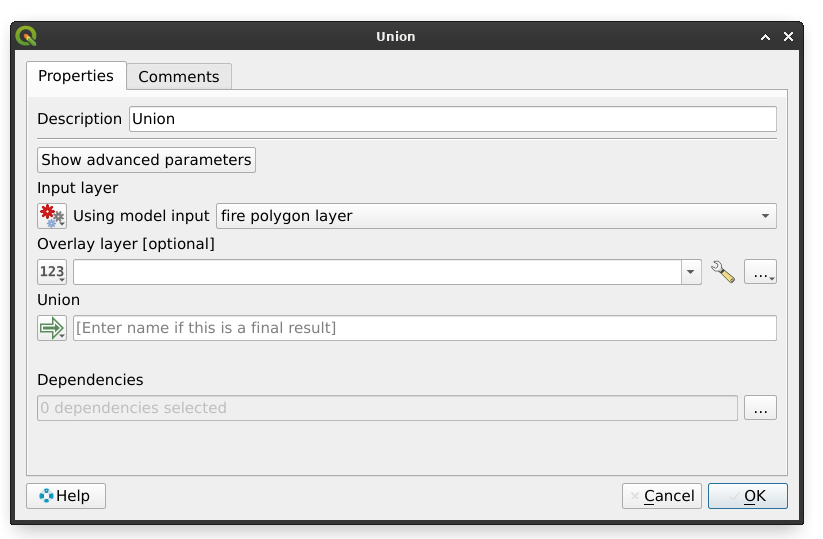
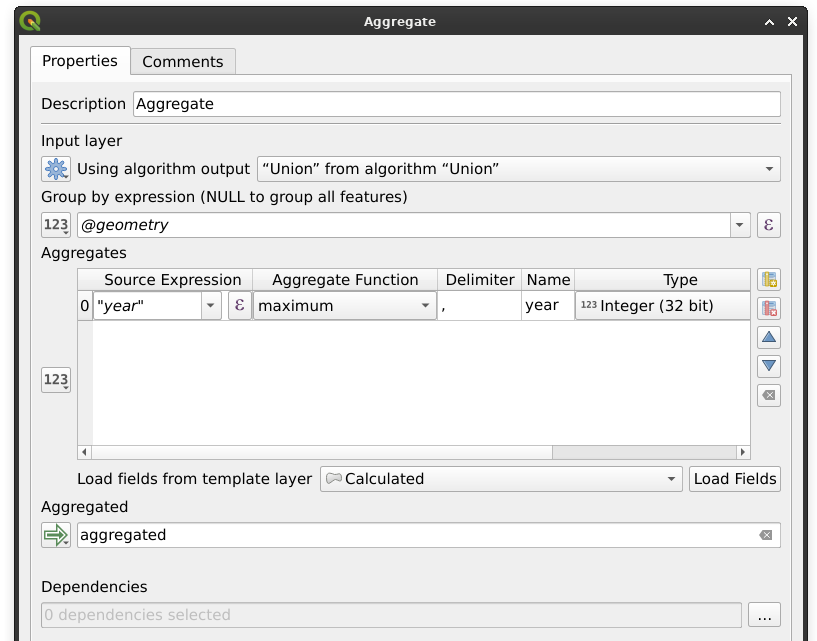
control feature rendering orderbased on your date field, and use a colour ramp based on date. See gis.stackexchange.com/questions/183048/…. Most recent fires would be on top in any case, with a different colour than any potential underlying older fire.