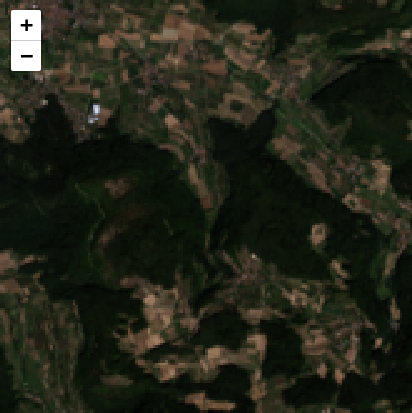
I'm working with an RGB raster in leaflet (some Landsat data). I'm stretching and sampling it down so that it's small enough. The following works great.
# stretch and then resample like geom_spatraster
landsat_rgb_stretched <- stretch(landsat_colors_1230[[1:3]],
                                 minq = 0.02, maxq = 0.98) |>
  spatSample(size = 5e5, as.raster = TRUE, method = "regular")

# set RGB channels
RGB(landsat_rgb_stretched) <- 3:1

# plot
plotRGB(landsat_rgb_stretched)
But, when I try and put it into leaflet, I get a muddled mess. It's close, but, very weird. I'm trying to figure out why.
# interactive plot
leaflet() |>
  addRasterImage(landsat_rgb_stretched)
Do I need to do something else to specify how levels are weighted, or are there arguments I'm missing here?

