0

I tried using the code below to download the data. I have doubts about the correctness of the code.

Can you help me correct it?

I encountered errors, which may be due to the large size of the dataset. Additionally, I'm plotting the data, which might cause further issues.

ar roi = geometry;

// Define the time range
var startDate = '2021-01-01';
var endDate = '2021-05-31';

// Create a date range
var dateRange = ee.DateRange(startDate, endDate);

// Load ERA5-Land temperature data
var era5Land = ee.ImageCollection('ECMWF/ERA5_LAND/DAILY_AGGR')
  .filterBounds(roi)
  .filterDate(dateRange)
  .select(['temperature_2m']);

// Aggregate the data to daily scale by calculating the mean
var dailyEra5Land = era5Land.mean();

// Print the first image in the collection
print('First image in the collection:', dailyEra5Land);

// Create a time series chart for temperature
var tempChart = ui.Chart.image.seriesByRegion({
  imageCollection: era5Land,
  regions: roi,
  reducer: ee.Reducer.mean(),
  scale: 10000,
  xProperty: 'system:time_start'
}).setOptions({
  title: 'Temperature Time Series',
  hAxis: {title: 'Date'},
  vAxis: {title: 'Temperature (°C)'},
});

1 Answer 1

1

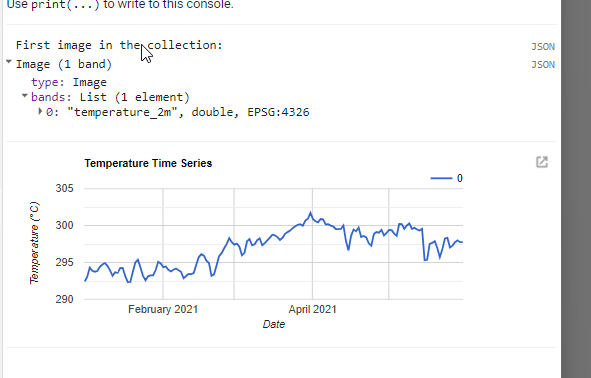
You're using era5Land (the original image collection) instead of dailyEra5Land (the aggregated daily mean) when creating the time series chart.

var admin2 = ee.FeatureCollection("FAO/GAUL_SIMPLIFIED_500m/2015/level2");
 
var bangalore = admin2.filter(ee.Filter.eq('ADM2_NAME', 'Bangalore Urban'))
var roi = bangalore.geometry()

// Define the time range
var startDate = '2021-01-01';
var endDate = '2021-05-31';

// Create a date range
var dateRange = ee.DateRange(startDate, endDate);

// Load ERA5-Land temperature data
var era5Land = ee.ImageCollection('ECMWF/ERA5_LAND/DAILY_AGGR')
  .filterBounds(roi)
  .filterDate(dateRange)
  .select(['temperature_2m']);

// Aggregate the data to daily scale by calculating the mean
var dailyEra5Land = era5Land.mean();

// Print the first image in the collection
print('First image in the collection:', dailyEra5Land);

// Create a time series chart for temperature
var tempChart = ui.Chart.image.seriesByRegion({
  imageCollection: era5Land,
  regions: roi,
  reducer: ee.Reducer.mean(),
  scale: 10000,
  xProperty: 'system:time_start'
}).setOptions({
  title: 'Temperature Time Series',
  hAxis: { title: 'Date' },
  vAxis: { title: 'Temperature (°C)' },
});

// Print the chart
print(tempChart);

enter image description here

7
  • I am getting the error after changing to my study area, which is more than 3 lakh sqkm. Error is : Error generating chart: Invalid JSON:
    – N Satish
    Commented Feb 20 at 7:24
  • Would you mind sharing your study area? I could try and reproduce the error @NSatish
    – Nil
    Commented Feb 20 at 7:28
  • The problem may be that your data is multipolygon. You have 8 elements in coordinates i.imgur.com/UNOJTz4.png and regions expects a list in seriesByRegion (Feature|FeatureCollection|Geometry|List<Feature>|List<Geometry>): But it is just an assumption as i am also not the expert with the too.
    – Nil
    Commented Feb 20 at 8:59
  • i will check it thank you for your help @Nil
    – N Satish
    Commented Feb 20 at 10:48
  • I can see only one polygon in the q gis attribute table. Is there any other way to do it? I need temperature and precipitation data for that basin (Godavari river basin) @Nil the code is working if given for 1 month period if I make it 5 months it is throwing the error
    – N Satish
    Commented Feb 20 at 11:14

Your Answer

By clicking “Post Your Answer”, you agree to our terms of service and acknowledge you have read our privacy policy.

Not the answer you're looking for? Browse other questions tagged or ask your own question.