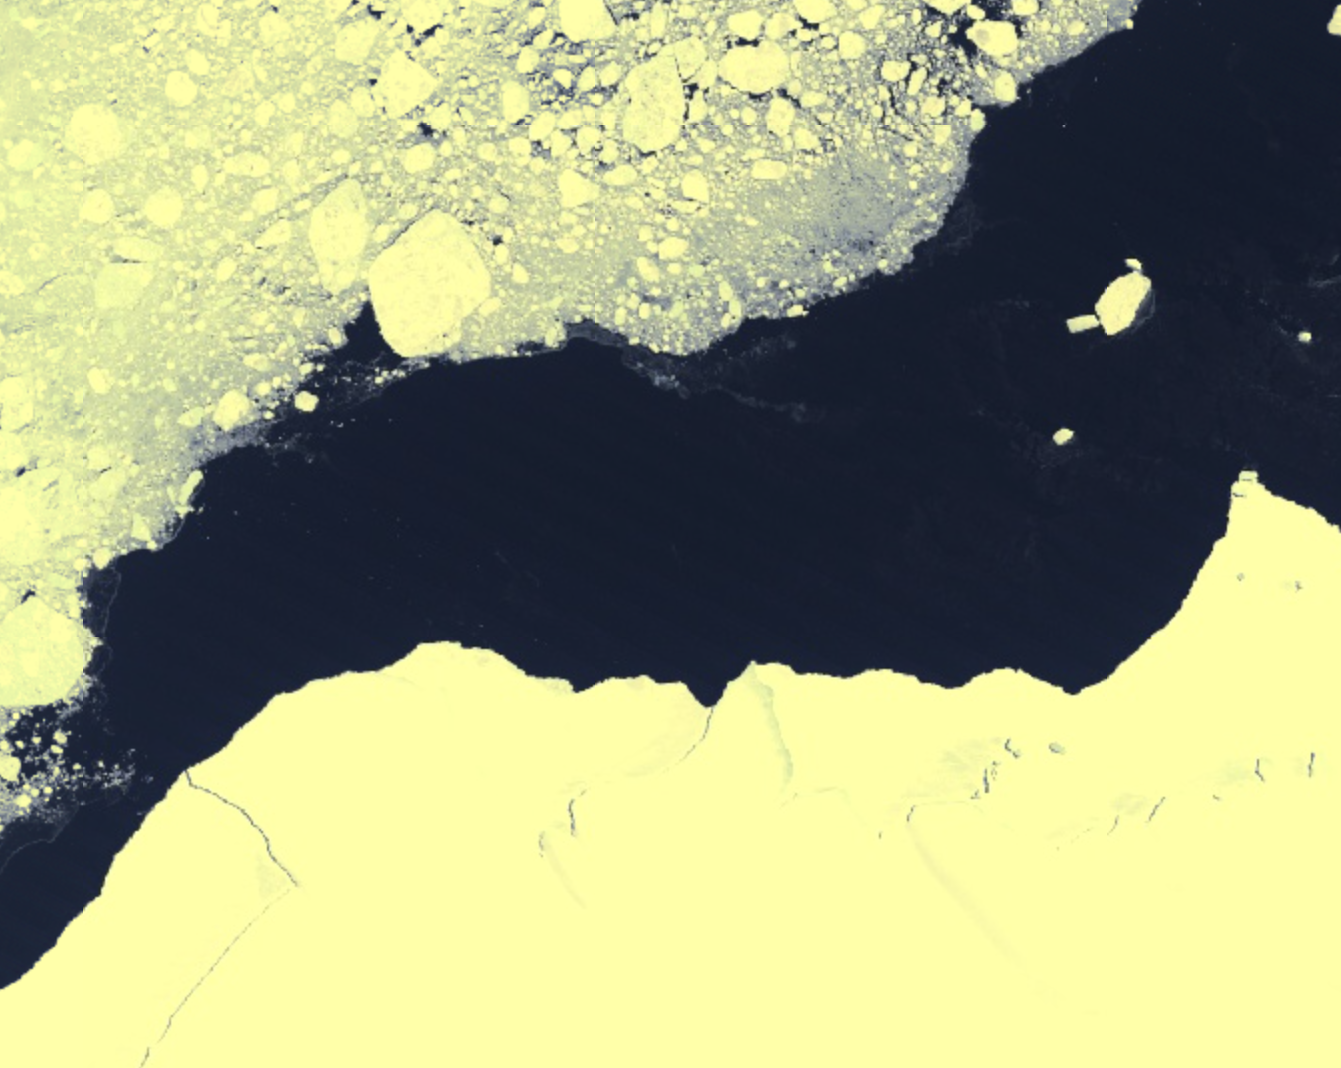
Try this code to access the data you want from GEE based on the collection date for the image you are interested in. (adjust filter dates on line 2)
var dataset = ee.ImageCollection('LANDSAT/LT05/C02/T2_L2')
    .filterDate('2000-11-01', '2001-01-01');

// Applies scaling factors.
function applyScaleFactors(image) {
  var opticalBands = image.select('SR_B.').multiply(0.0000275).add(-0.2);
  var thermalBand = image.select('ST_B6').multiply(0.00341802).add(149.0);
  return image.addBands(opticalBands, null, true)
              .addBands(thermalBand, null, true);
}

dataset = dataset.map(applyScaleFactors);

var visualization = {
  bands: ['SR_B3', 'SR_B2', 'SR_B1'],
  min: 0.0,
  max: 0.8,
};

Map.setCenter(-83, 24, 8);

Map.addLayer(dataset, visualization, 'True Color (321)');
The important thing is to apply the scaling factors so that your data are in reflectance and not digital numbers. Once you have done that, you can tweak the way the colors are rendered by adjusting the saturation value max: 0.8

