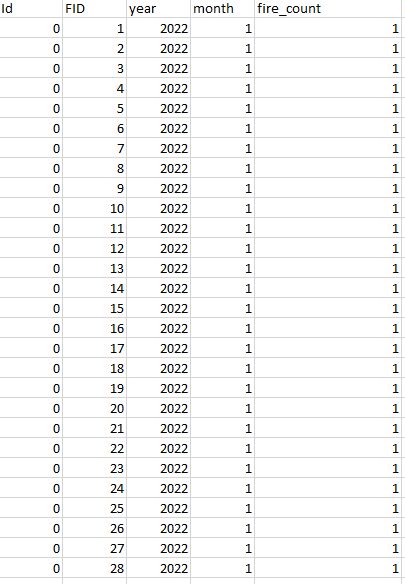
I am running using the spatial join function on R, to calculate the fire occurrences in each grid for different months (1-12)and years (2001-2022). However, the fire count values from the result table seem incorrect compared to the data view from ArcGIS. Here is the code and the data I am using.
There are two datasets being used:
- Active fire counts, each row means a fire point (with separate columns of the month, year of the fire occurrence)
- Grid (using fishnet function on ArcGIS pro to create 5km resolution grids as a study unit)
1.Load the data
library(sf)
library(dplyr)
library(tidyr)

smaller_area<- st_read("subset_area.shp")
grid <- st_read("GridData/grid_5km.shp")
grid_subset <- st_intersection(grid, smaller_area)

fire_points <- st_read("fire_active_MC61_2001_202301_Con80_typeP.shp")
fire_points_subset <- st_intersection(fire_points, smaller_area)
grid_subset$FID <- 1:nrow(grid_subset) #make a FID for every grid
2. Counting the fire counts for each grid, or different months and years
results <- list() #create a dataframe
#create a loop for every month and year
for (year in 2001:2022) {
  for (month in 1:12) {

    fire_points_filtered <- fire_points_subset %>%
    filter(Year == year, Month == month) #the column names of the fire point data are 'Year', 'Month', and I filter them to count the fire occurrences

    fire_counts <- st_join(grid_subset, fire_points_filtered, join = st_contains) #spatial join the fire point and the grid

    fire_counts <- fire_counts %>%
      group_by(FID) %>% #group by FID and count fire occurrences
      summarize(fire_count = n(), .groups = 'drop')%>% #count the fire
      complete(FID = unique(grid_subset$FID), fill = list(fire_count = 0))  #no fire=0

    if (nrow(fire_counts) == 0) {
      fire_counts <- data.frame(FID = grid_subset$FID, fire_count = 0)
    } #ensure fire_counts has the same number of rows as grid_subset

      data <- grid_subset %>%
      st_drop_geometry() %>%
      mutate(
        year = year,
        month = month,
        fire_count = fire_counts$fire_count[match(FID, fire_counts$FID)]) %>%
      replace_na(list(fire_count = 0))

    results[[paste0(year, "_", month)]] <- data
  }
}

subset_final_data <- do.call(rbind, results)

write.csv(subset_final_data, "subset_final_data.csv", row.names = FALSE)
My expected output is a dataset with every row representing each grid for each month of different years (e.g gridFID=2, year=2005, month=5, fire count=5; gridFID=10, year=2007 month=12 fire count=2...). However, the fire count output of this code seems obviously incorrect, as there are many grids have no fire point during the entire time period, but the minimum fire count of the output table is '1' instead.
The figure below is the view from ArcGIS, showing that many grids have no fire point during the entire study period.
The figure below show my final output data, but the minimum value for the fire count is 1 instead of 0 (and most of the values in fire_count is 1)

The solution was provided by @Grzegorz Sapijaszko as follows: The code below starts after loading the data and creating the data frame.
for (year in 2001:2022) {
  for (month in 1:12) {
    # Filter fire points for the current year and month
    fire_points_filtered <- fire_points_subset %>%
      filter(Year == year, Month == month)

    # Calculate the number of fire points in each grid cell
    fire_counts <- lengths(sf::st_intersects(grid_subset, fire_points_filtered))

    # Create a data frame with the results
    fire_counts_df <- data.frame(
      FID = grid_subset$FID,
      year = year,
      month = month,
      fire_count = fire_counts
    )

    # Store the result
    results[[paste0(year, "_", sprintf("%02d", month))]] <- fire_counts_df
  }
}

# Combine all results into a single data frame
subset_data <- bind_rows(results)

write.csv(subset_data, "subset_fire.csv", row.names = FALSE)


if(nrow(fire_counts))line is doing what you expect? Also your code is incomplete, I assume there's a couple of closing curly brackets to finish the loops but maybe something else missing? Hit the edit button and make some changes...if(nrow(fire_counts))line is also not working since value '1' is still the smallest among the 'fire count'. I have edited the complete code (basically the closing and return the result.