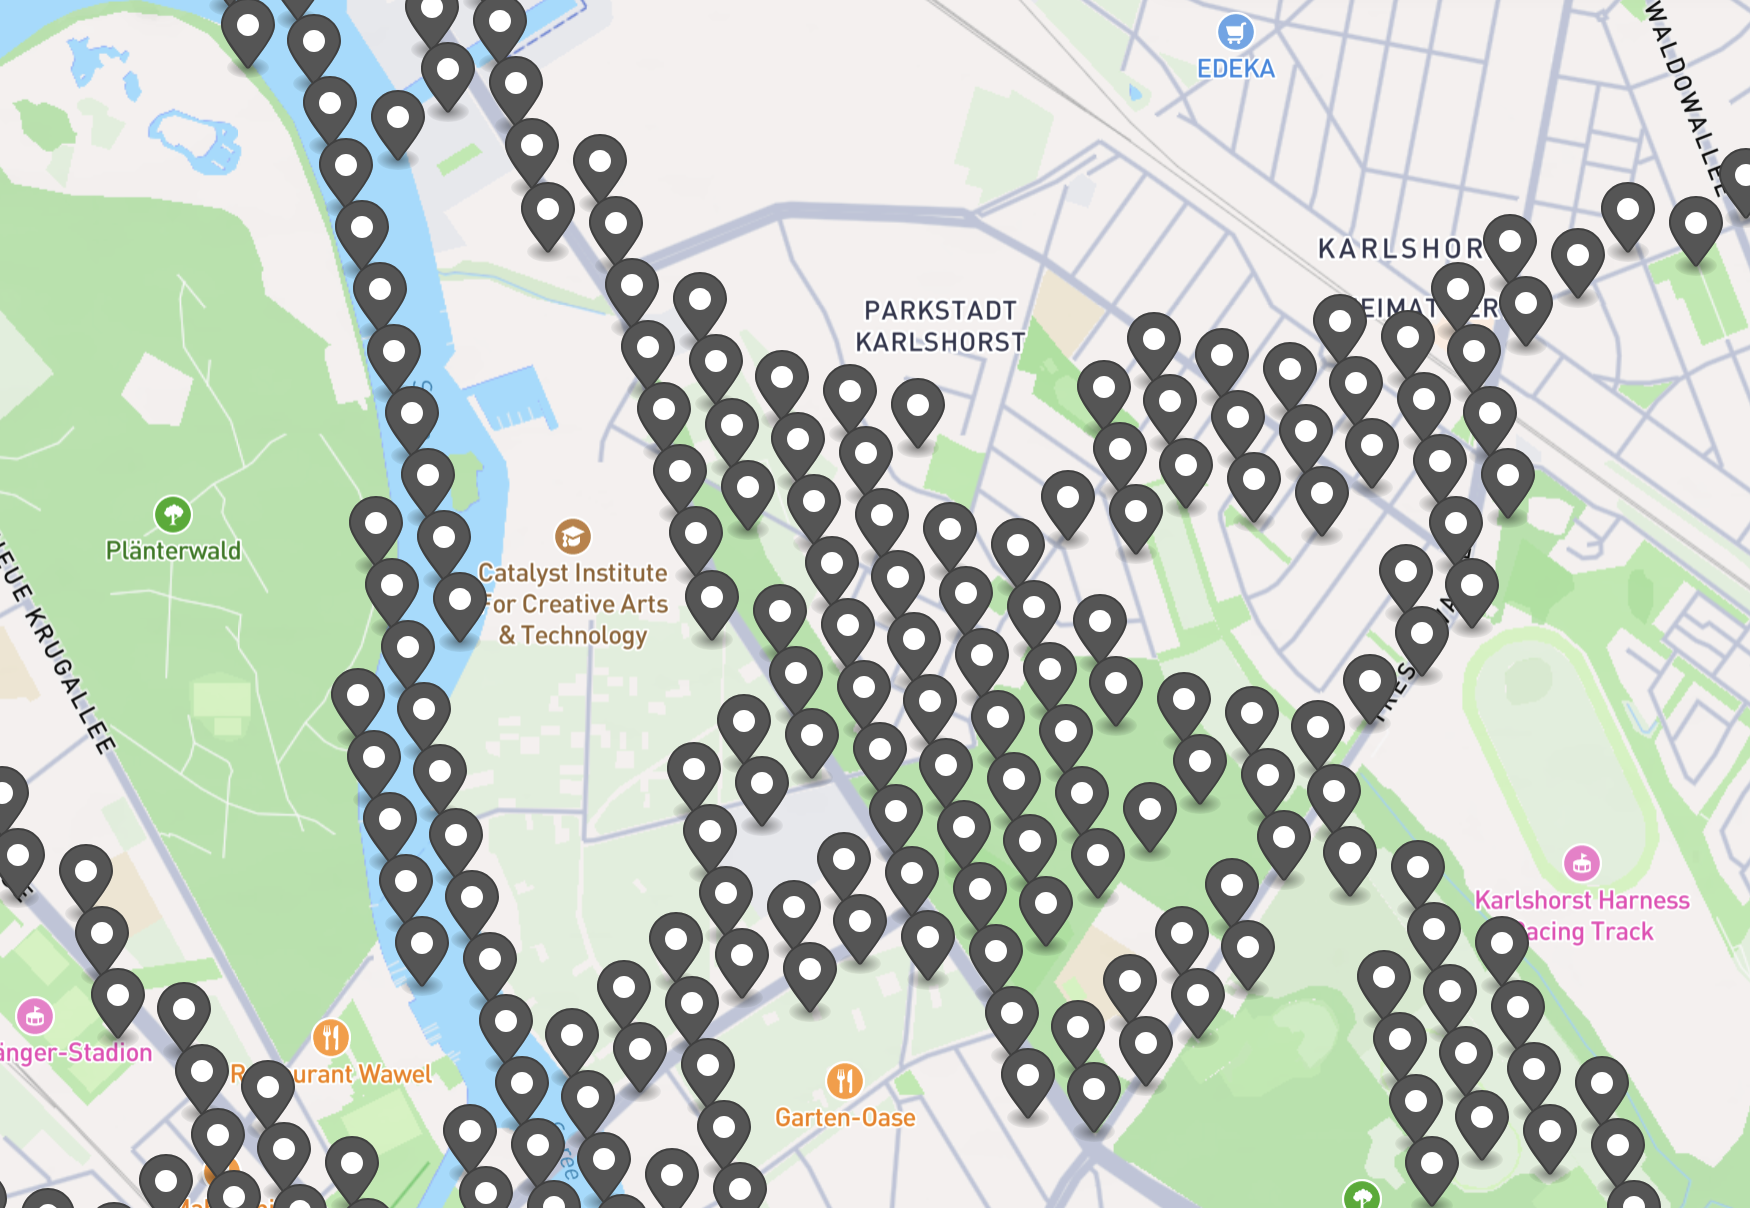
I have this GeoJSON (can be downloaded here). The data is distributed through a grid, thus the points are distributed regularly.
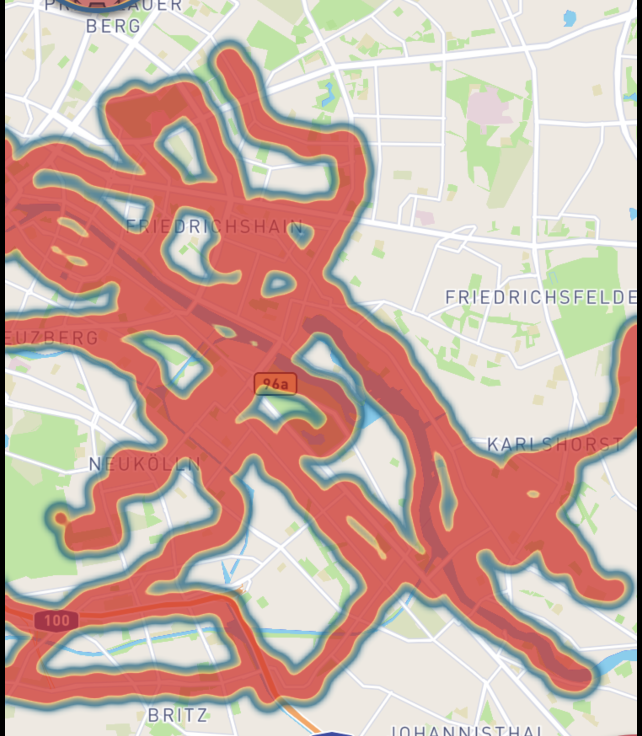
However, each point has a different "weight" via the prop count assigned to it. The vast majority has count 1. The max value of count is 90. I want to display a heatmap with Mapbox, but it looks everywhere the same.
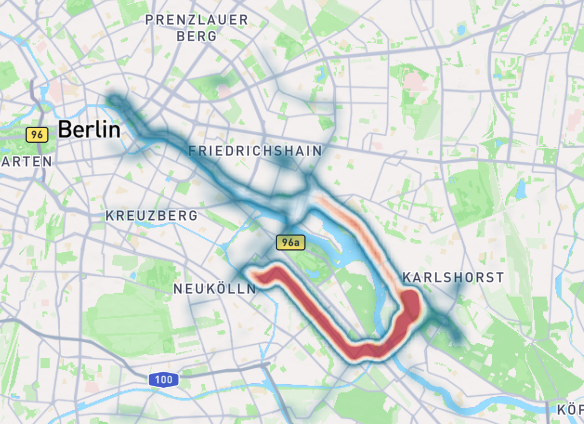
I would expect some areas to be darker in color and others not. But like this, it all looks the same...
These are my heatmap settings (note: its React code, which is why - have been converted to CamelCase)
<!DOCTYPE html>
<html>

<head>
    <meta charset="utf-8">
    <title>Create a heatmap layer</title>
    <meta name="viewport" content="initial-scale=1,maximum-scale=1,user-scalable=no">
    <link href="https://api.mapbox.com/mapbox-gl-js/v3.5.1/mapbox-gl.css" rel="stylesheet">
    <script src="https://api.mapbox.com/mapbox-gl-js/v3.5.1/mapbox-gl.js"></script>
    <style>
        body { margin: 0; padding: 0; }
         #map { position: absolute; top: 0; bottom: 0; width: 100%; }
    </style>
</head>

<body>
    <div id="map"></div>
    <script>
        mapboxgl.accessToken = '...';
            const map = new mapboxgl.Map({
                container: 'map',
                center: [52, 13],
                zoom: 4
            });

            map.on('load', () => {
                map.addSource('movementData', {
                    'type': 'geojson',
                    'data': 'the/data/I/provided/for/download'
                });

                map.addLayer(
                    {
                        'id': 'movement-heat',
                        'type': 'heatmap',
                        'source': 'movementData',
                        'maxzoom': 15,
                        'paint': {
                            "heatmap-color": [
                                "interpolate",
                                [
                                  "linear"
                                ],
                                [
                                  "heatmap-density"
                                ],
                                0,
                                "rgba(33,102,172,0)",
                                0.2,
                                "#005F80",
                                0.4,
                                "rgb(209,229,240)",
                                0.6,
                                "rgb(253,219,199)",
                                0.8,
                                "rgb(239,138,98)",
                                1,
                                "rgb(178,24,43)"
                              ],
                              "heatmap-intensity": [
                                "interpolate",
                                [
                                  "linear"
                                ],
                                [
                                  "zoom"
                                ],
                                2,
                                1,
                                15,
                                4
                              ],
                              "heatmap-opacity": 0.7,
                              "heatmap-radius": [
                                "interpolate",
                                [
                                  "linear"
                                ],
                                [
                                  "zoom"
                                ],
                                2,
                                36,
                                15,
                                1
                              ],
                              "heatmap-weight": [
                                "interpolate",
                                [
                                  "linear"
                                ],
                                [
                                  "get",
                                  "value"
                                ],
                                1,
                                0,
                                90,
                                1
                              ]
                        }
                    },
                );
            });
    </script>
</body>
</html>
Why are there no "denser" and "no-denser" areas being colored?


