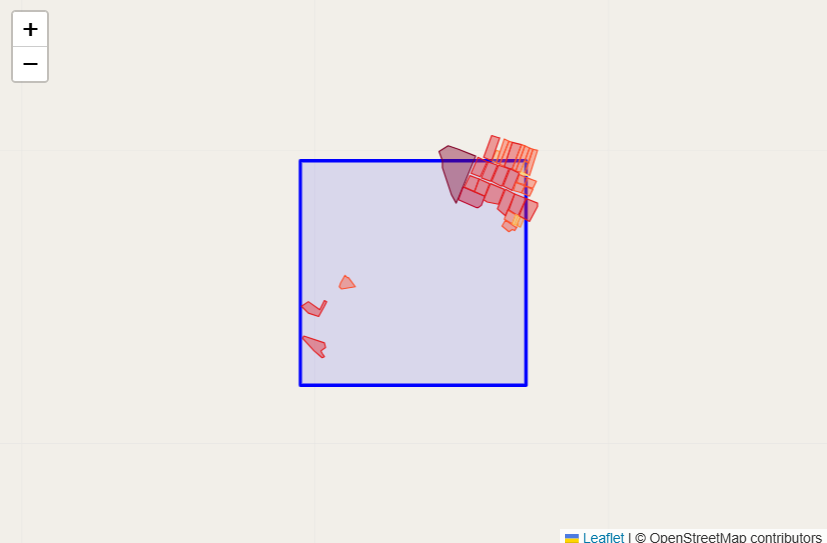
I use the code sample from https://flatgeobuf.org/examples/leaflet/large.html. My code is following:
document.addEventListener("DOMContentLoaded", async () => { console.log('THERE');
//////////////////////////////
//map = L.map('map', {
// zoomControl:false, maxZoom:28, minZoom:1
//}).fitBounds([[24.69013990167979,121.80364150896582],[24.690963404516896,121.80496755608748]]);
let map = L.map('map').setView([lat, lng], 15);
L.tileLayer('https://{s}.tile.openstreetmap.org/{z}/{x}/{y}.png', {
maxZoom: 19,
attribution: '© OpenStreetMap contributors'
}).addTo(map);
//var hash = new L.Hash(map);
//map.attributionControl.setPrefix('qgis2web · Leaflet · QGIS');
//var autolinker = new Autolinker({truncate: {length: 30, location: 'smart'}});
// remove popup's row if "visible-with-data"
function removeEmptyRowsFromPopupContent(content, feature) {
var tempDiv = document.createElement('div');
tempDiv.innerHTML = content;
var rows = tempDiv.querySelectorAll('tr');
for (var i = 0; i < rows.length; i++) {
var td = rows[i].querySelector('td.visible-with-data');
var key = td ? td.id : '';
if (td && td.classList.contains('visible-with-data') && feature.properties[key] == null) {
rows[i].parentNode.removeChild(rows[i]);
}
}
return tempDiv.innerHTML;
}
// add class to format popup if it contains media
function addClassToPopupIfMedia(content, popup) {
var tempDiv = document.createElement('div');
tempDiv.innerHTML = content;
if (tempDiv.querySelector('td img')) {
popup._contentNode.classList.add('media');
// Delay to force the redraw
setTimeout(function() {
popup.update();
}, 10);
} else {
popup._contentNode.classList.remove('media');
}
}
//var zoomControl = L.control.zoom({
// position: 'topleft'
//}).addTo(map);
//var bounds_group = new L.featureGroup([]);
//var bounds_group1 = new L.featureGroup([]);
//function setBounds() {
//}
//map.createPane('pane_TaiwaneMapnew_0');
//map.getPane('pane_TaiwaneMapnew_0').style.zIndex = -1;
// var layer_TaiwaneMapnew_0 = L.WMS.layer("http://maps.nlsc.gov.tw/S_Maps/wms", "EMAP97", {
// pane: 'pane_TaiwaneMapnew_0',
// format: 'image/png',
// uppercase: true,
// transparent: true,
// continuousWorld : true,
// tiled: true,
// info_format: 'text/html',
// opacity: 1,
// identify: false,
// attribution: '',
//});
//map.addLayer(layer_TaiwaneMapnew_0);
// optionally show some meta-data about the FGB file
function handleHeaderMeta(headerMeta) {
const header = document.getElementById('header')
const formatter = new JSONFormatter(headerMeta, 10)
while (header.firstChild)
header.removeChild(header.firstChild)
header.appendChild(formatter.render())
}

        // For the example, we fix a visible Rect representing the query
        // bounding box in the middle of the map
        function getBoundForRect() {
            //console.log(map.getCenter());
            //const widthMeters = 200;
            //return map.getCenter().toBounds(widthMeters);
            const bounds = map.getBounds();

            const width = map.distance(bounds.getNorthWest(), bounds.getNorthEast());
            const height = map.distance(bounds.getNorthWest(), bounds.getSouthWest());
            return map.getCenter().toBounds(Math.min(width, height) * 0.41);
        }

        // convert the rect into the format flatgeobuf expects

  function fgBoundingBox() {
            const bounds = getBoundForRect();
            console.log(bounds);
            return {
                minY: bounds.getSouth(),
                maxY: bounds.getNorth(),
                minX: bounds.getWest(),
                maxX: bounds.getEast(),
            };
        }

        bboxObjectToArray = (obj) => [
            [obj.minX, obj.minY],
            [obj.maxX, obj.maxY],
        ];
// show a leaflet rect corresponding to our bounding box
rectangle = L.rectangle(getBoundForRect(), {
interactive: false,
color: "blue",
fillOpacity: 0.1,
opacity: 1.0,
}).addTo(map);
rectangle.bringToFront();
// track the previous results so we can remove them when adding new results
let previousResults = L.layerGroup().addTo(map);
async function updateResults() {
// remove the old results
previousResults.remove();
const nextResults = L.layerGroup().addTo(map);
previousResults = nextResults;
//console.log(nextResults);

            // Use flatgeobuf JavaScript API to iterate features as geojson.
            // Because we specify a bounding box, flatgeobuf will only fetch the relevant subset of data,
            // rather than the entire file.
            const colorScale = ((d) => {
                //console.log(d);
                return d > 7500 ? '#800026' :
                    d > 5000 ? '#BD0026' :
                    d > 2500  ? '#E31A1C' :
                    d > 1000 ? '#FC4E2A' :
                    d > 500   ? '#FD8D3C' :
                    d > 250  ? '#FEB24C' :
                    d > 100   ? '#FED976' :
                    '#FFEDA0'
            });//console.log(colorScale);

            const iter = flatgeobuf.deserialize('data/Gy_A_rice_weight_UTMz51_1.fgb',bboxObjectToArray(fgBoundingBox()),handleHeaderMeta);
            const results = L.layerGroup().addTo(map);
            //console.log(iter);
            try{
            let i = 0;results1 = { type: "FeatureCollection", features: [] };
            for await(let feature of iter){//console.log("FEATURE:"+feature);
                if(feature!=null){
                results1.features.push({...feature, id: i});
                i+=1;//console.log(i);
                }
                // Leaflet styling
                const defaultStyle = {
                    color: colorScale(feature.properties["Area"]),
                    weight: 1,
                    fillOpacity: 0.4,
                };
                L.geoJSON(feature, {
                    style: defaultStyle,
                }).on({
                    'mouseover': function(e) {
                        const layer = e.target;
                        layer.setStyle({
                            weight: 4,
                            fillOpacity: 0.8,
                        });
                        layer.bringToFront();
                        console.log(layer);
                    },
                    'mouseout': function(e) {
                        const layer = e.target;
                        layer.setStyle(defaultStyle);console.log(layer);
                    }
               }).bindPopup(`${feature.properties["Area"]} people live in this census block.</h1>`).addTo(nextResults);//.bindPopup(`${feature.properties["Area"]} people live in this census block.</h1>`)
            }
            }
            catch(e){console.log(e);return;}
        // if the user is panning around alot, only update once per second max
        updateResults = _.throttle(updateResults, 100);
        }
        // show a leaflet rect corresponding to our bounding box
        //let rectangle = L.rectangle(getBoundForRect(), { color: "blue", fillOpacity: 0.7, opacity: 1.0 }).addTo(map);
        // Render the bounding box rectangle

        //rectangle.bringToFront();
        // show results based on the initial map
        updateResults();
        // ...and update the results whenever the map moves
        map.on("moveend", function(s){
            rectangle.setBounds(getBoundForRect());
            updateResults();
        });
Data is available here: https://www.dropbox.com/scl/fi/s5721ev5tddmakobl3g92/Gy_A_rice_weight_UTMz51_1.fgb?rlkey=dxd6359fmhfa0y151y6wv89b8&st=t691m0ar&dl=0
Sample code gives the right filtering number: 470 features: My code gives me all the features, which is not desirable: 105,014 features
I've checked over n over but still can't figure out why.

