3

I have an ArcGIS grid ascii file (Ramankutty Cropland at 5 minute resolution) that begins as follows:

ncols         4320 
nrows         2160 
xllcorner     -180 
yllcorner       -90 
cellsize      0.08332825 
NODATA_value  -9999
-9999 -9999 -9999 -9999 -9999 -9999 -9999  
...

Someone gave me this file but did not provide a projection and could not recall what it was. However, I have some reason to believe the projection is WGS1984:

GEOGCS["GCS_WGS_1984",DATUM["D_WGS_1984",SPHEROID["WGS_1984",6378137,298.257223563]],PRIMEM["Greenwich",0],UNIT["Degree",0.017453292519943295]]

I would like to be able to convert this to a format that CartoDB could use--an ESRI shapefile. Another person who did manage this, but who also could not recall the procedure, created a polygonal coverage of grid squares (closed oriented loops). The values at the row and column numbers were assigned to the polygonal squares (somehow--I do not know the data structures involved).

Is there a way to create some kind of polygonal grid square coverage without using ArcGIS (I'm guessing this was used, but no details were provided to me)? Open source tools would be nice, but if ArcGIS is necessary, so be it.

As an alternative, I tried gdal_translate -of GTIFF -a_srs WGS1984.prj ... and uploaded the result to CartoDB, but CartoDB complained that the result was not georeferenced (the_geom lat/lon GeoJSON was empty).

(I'm not sure how to apologize for asking such vague and uninformed questions.)

Some more info: here's part of a row from the ESRI shapefile of this data that was imported into CartoDB

**id**  1
**the_geom** {"type":"MultiPolygon","coordinates":[[[[-8.7649,37.34027], [-8.87019,37.36377],[-8.79447,37.42393],[-8.7649,37.34027]]]]}
**shape_area** 63274611.152
**shape_leng** 36270.0549322

Another row:

**id**  2
**the_geom** {"type":"MultiPolygon","coordinates":[[[[-8.59219,37.34027],[-8.67854,37.34027],[-8.67854,37.40889],[-8.59219,37.40889],[-8.59219,37.34027]]]]}
**shape_area** 92417860.2
**shape_leng** 38453.683350300001621

4 Answers 4

5

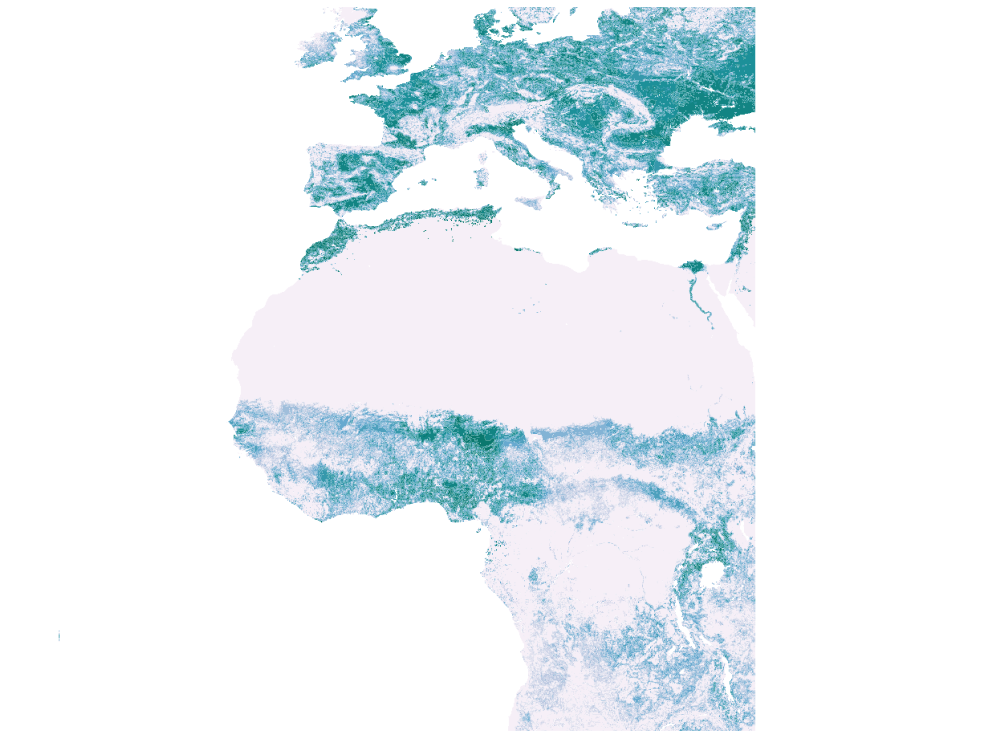
In answer to my own question, I've written a program to "vectorize" an ArcInfo Grid ASCII files as an ESRI shapefile with a single layer containing oriented polygonal grid squares centered at the points of the grid, with an attribute value equal to the value at the coordinates of the centroid. The program (still under development) is available on GitHub. An example of a map produced with the program is on CartoDB (it might not be for long). Perhaps one could have done this in GRASS. Space for detailed answers in this vein is provided below.

In case the map has to be taken down, here is a screen capture Ramankutty cropland

3

Try gdal_polygonize.py, which produces a polygon feature layer from a raster. There is a good API too.

1
  • I don't yet have sufficient reputation to vote this answer up. However, I did learn something by writing my own function. While it does not take unions of grid squares of discretized raster values sharing a common value, it does preserve the original raster value.
    – F Lengyel
    Commented Feb 17, 2013 at 8:56
2

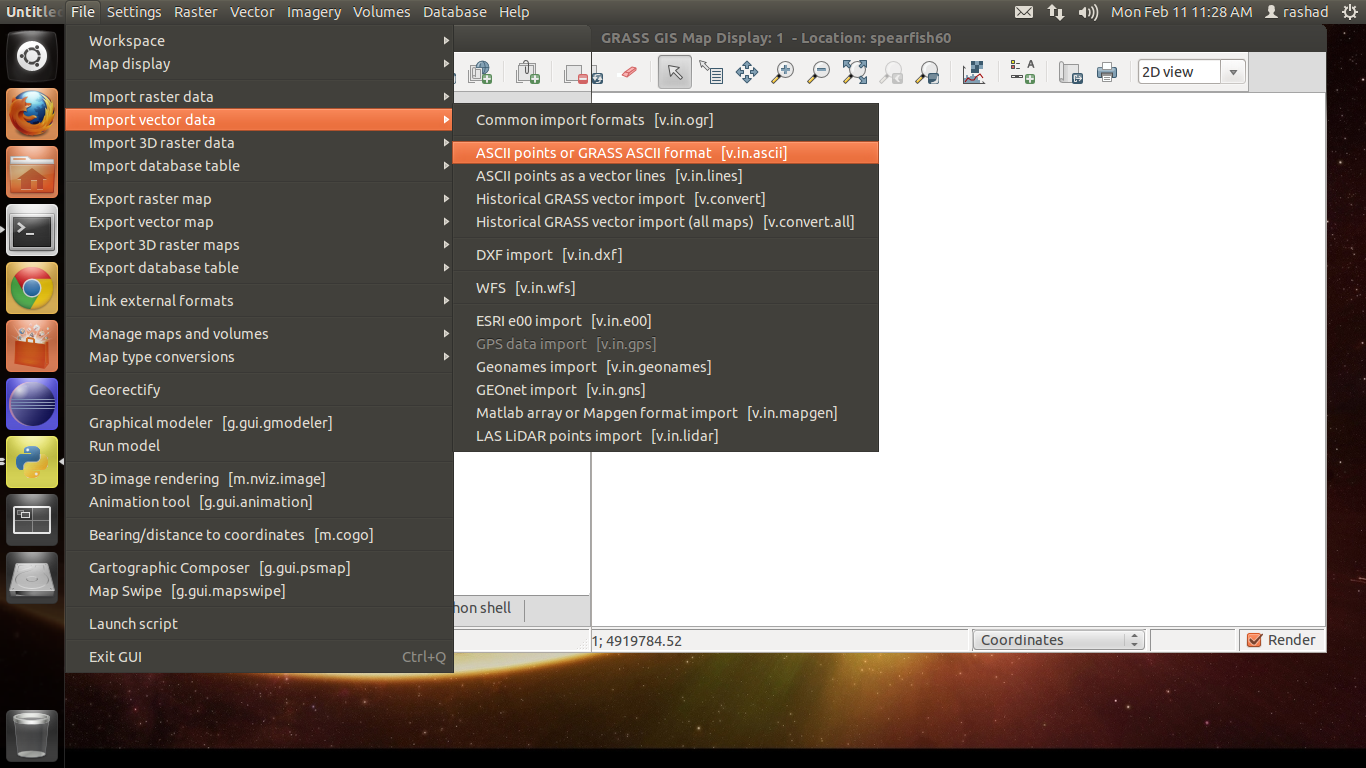
Because you said " Open source tools would be nice" try GRASS GIS ascii import v.in.ascii.

GRASS ASCII Import

5
  • This ended with errors: v.in.ascii input=~/Programming/CartoDB/ascii2tif/ramankutty_crop land2000_frac_5m.ascii output=ramvector fs=' ' skip=6 Scanning input for column types... Maximum input row length: 3999 Maximum number of columns: 1578 Minimum number of columns: 1 ERROR: y column number > minimum last column number (incorrect field separator?) (Mon Feb 11 01:14:05 2013) Command finished (31 sec)
    – F Lengyel
    Commented Feb 11, 2013 at 6:14
  • could you post the error here- pastebin.com
    – rkm
    Commented Feb 11, 2013 at 6:17
  • Why would this work? GRASS point format expects an x,y[,z] list, and this data is an ascii grid.
    – F Lengyel
    Commented Feb 11, 2013 at 6:25
  • QGIS was able to read the Grid ASCII file, but I ended up writing my own utility; see below.
    – F Lengyel
    Commented Feb 17, 2013 at 8:02
  • Judging from the converted file I have, the ArcGIS raster to vector conversion utility was used, after the data was discretized.
    – F Lengyel
    Commented Feb 17, 2013 at 8:17
2

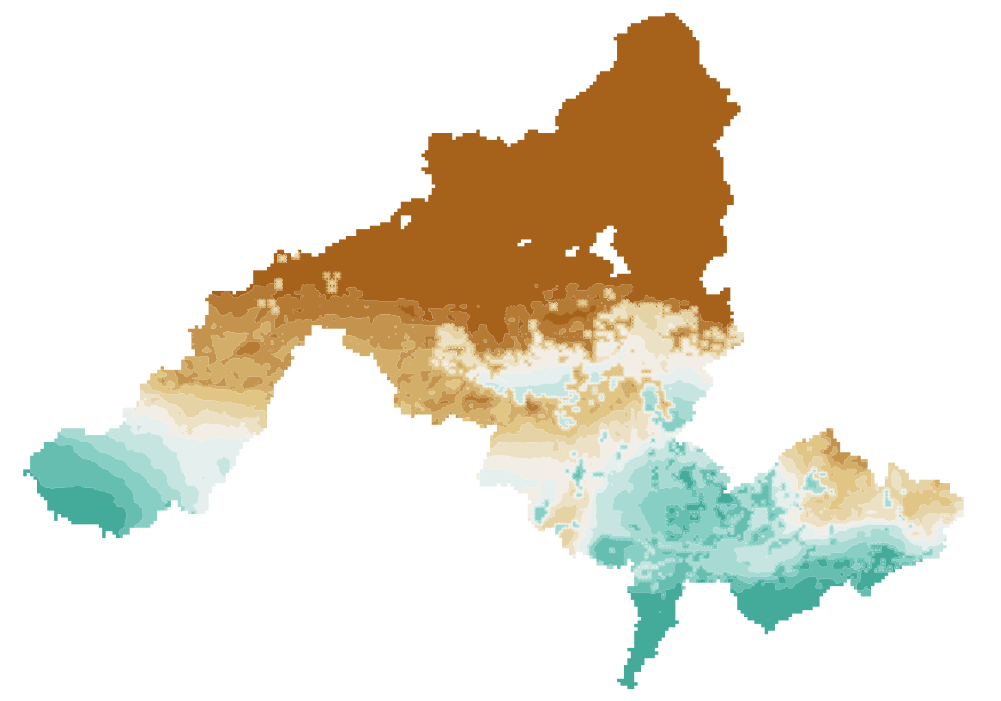
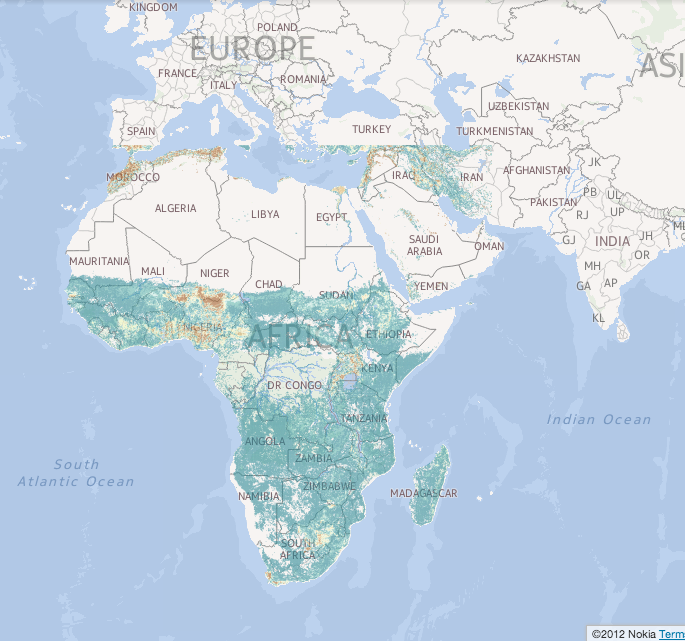
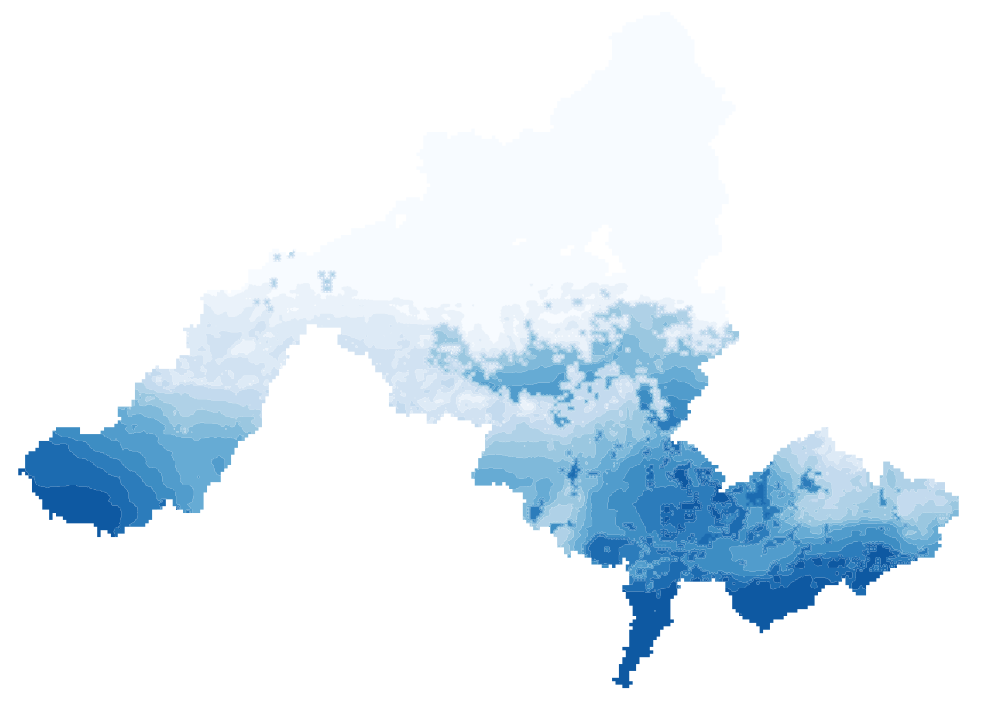
The previous version of the program produces large files. The latest version takes an ArcInfo Grid ASCII file, identifies the polygonal boundaries of annular regions directly in raster space, and writes out an ESRI shapefile. Following ESRI conventions, polygonal boundaries are oriented clockwise, and holes are oriented counterclockwise. Because the program runs in row-column coordinates, error-free computation is used to identify digital topology--geographic coordinates are written out only when the shapefiles are created. Local heuristics are used to identify new regions and holes; the heuristics can lead to decisions that have to be corrected later, but the use of local incremental heuristics is no worse on the average than identifying global geometric features directly. A histogram calculation was used to classify values by quantiles (equal value division is also available). The illustration below was a screen shot of a shapefile layer produced by the program (Annual Runoff in the Niger River Basin, year 2000, with cropland utilization 25% above year 2000 levels). Annual Runoff in the Niger River Basin, year 2000, with cropland utilization 25% above year 2000 levels. Other examples: Ramankutty Cropland and runoff in the Niger River Basin again: enter image description here
1
  • Notice the progression from the abysmal cluelessness of the question of February 11 to the software production of March 8th.
    – F Lengyel
    Commented Mar 9, 2013 at 0:13

Your Answer

By clicking “Post Your Answer”, you agree to our terms of service and acknowledge you have read our privacy policy.

Not the answer you're looking for? Browse other questions tagged or ask your own question.